
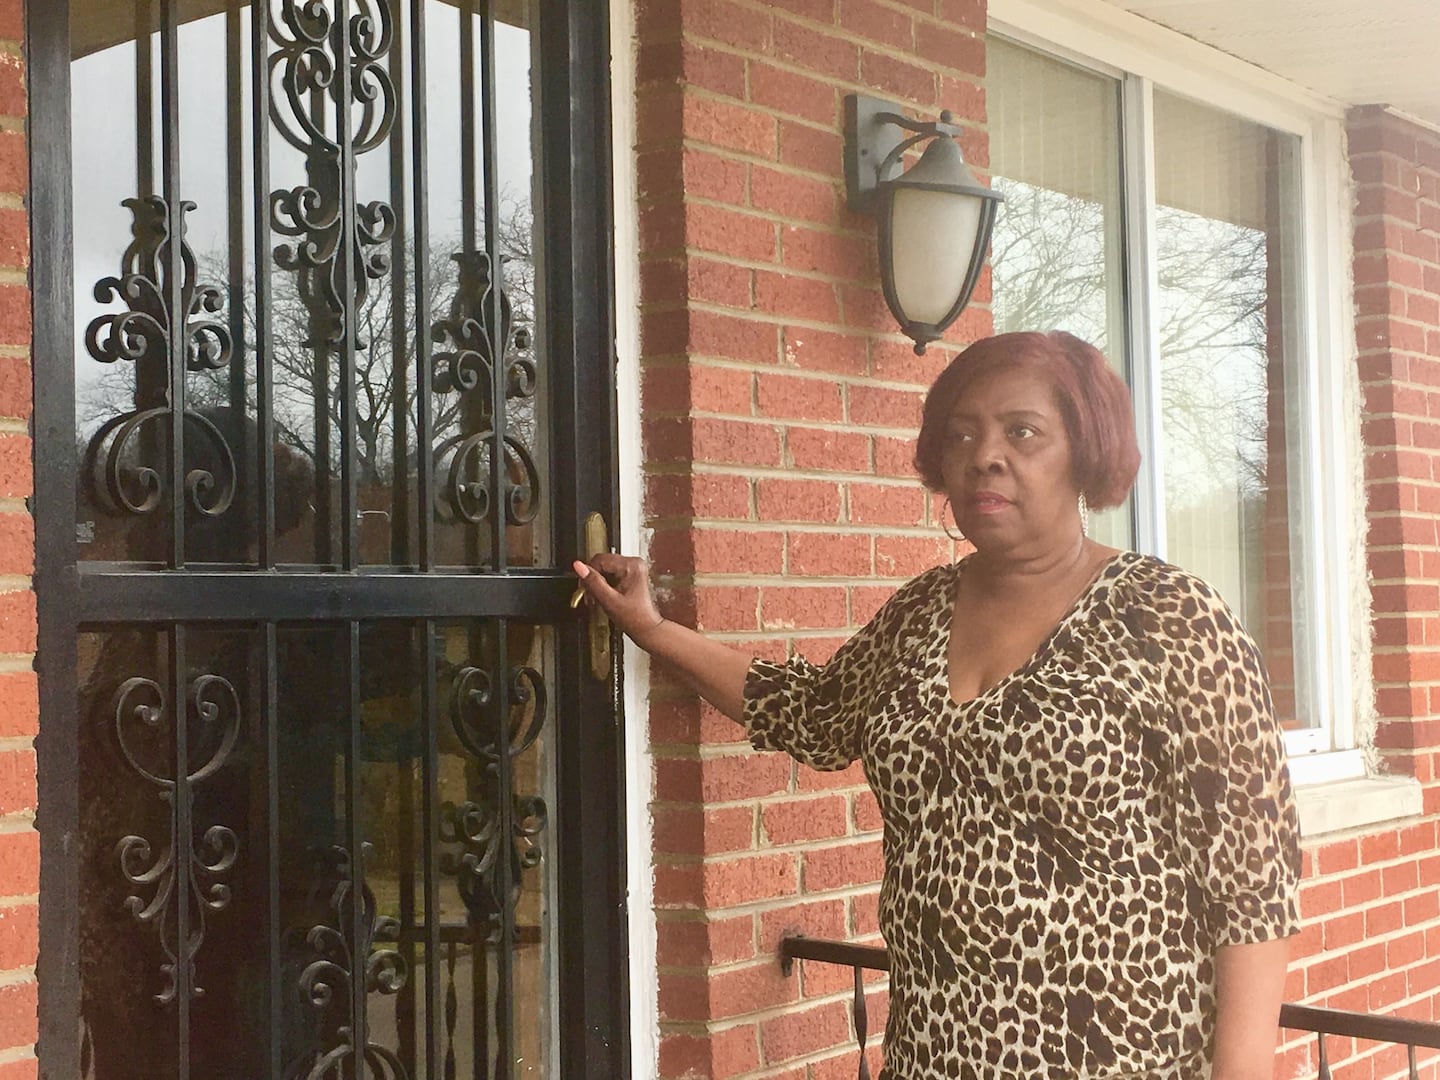
Redlining — the historical practice of refusing credit to homebuyers in minority neighborhoods — has been outlawed since 1968, and banks have a legal obligation to conduct fair lending under the Community Reinvestment Act. But in many places, including much of West Dayton and Trotwood, federal loan data shows the law hasn’t made much difference.
A Dayton Daily News analysis of home mortgage data gathered by Reveal from The Center for Investigative Reporting, shows black applicants in the Dayton metro area were 2.1 times as likely to be denied a conventional home mortgage as white applicants in 2015 and 2016.
You can read the full story here: Modern redlining: Racial disparities in lending persist in Dayton
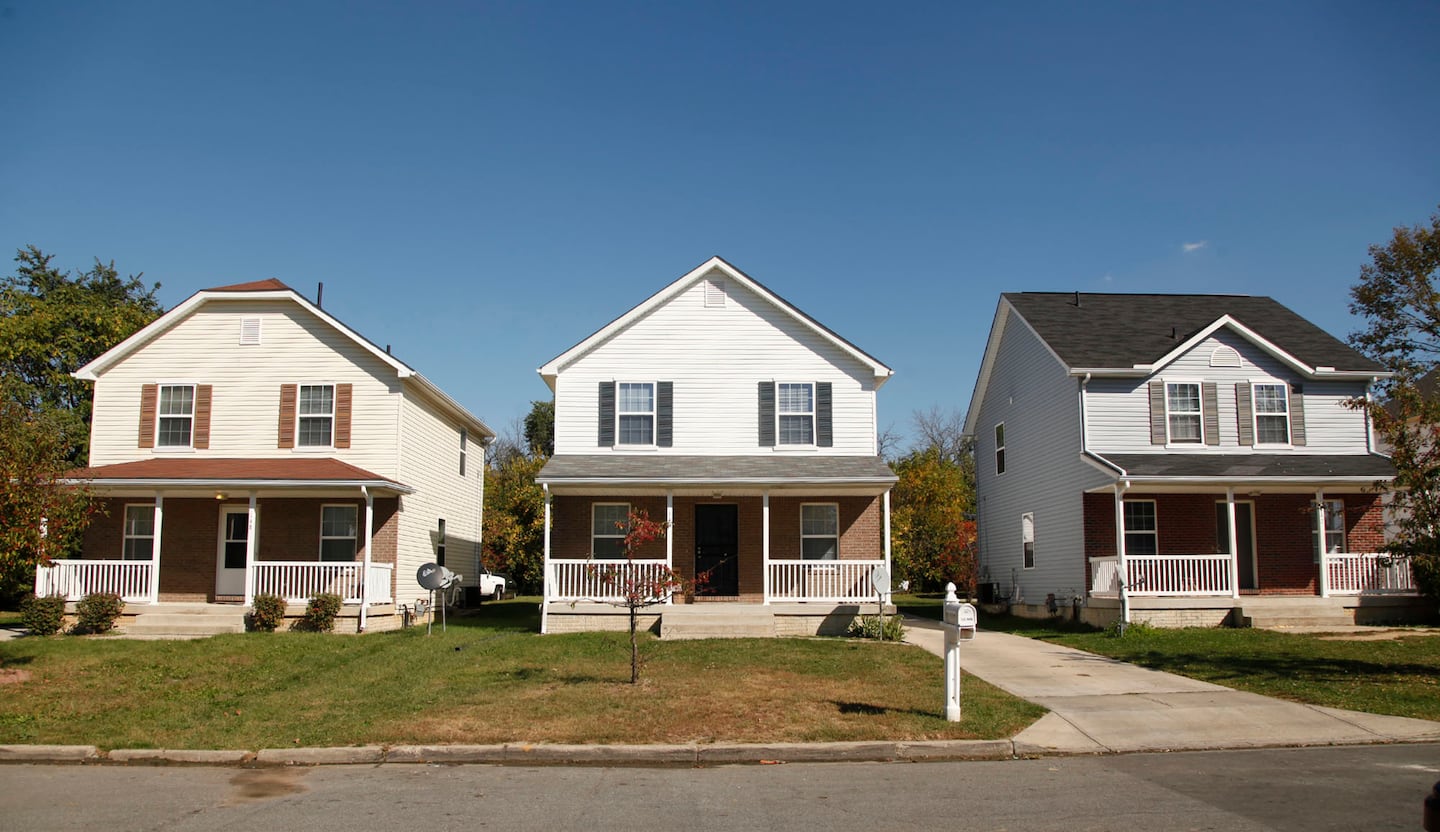
These 20 census tracts, all located in and around Dayton and Trotwood, had the highest denial rates for conventional mortgage loans in the entire metro area, which includes Montgomery, Greene and Miami counties. 14 of them are majority-black neighborhoods.
1. Census tract 3 – Wesleyan Hill neighborhood, Dayton.
2. Census tract 22 – Twin Towers neighborhood, Dayton.
3. Census tract 707 – Fort McKinley neighborhood, northeast Trotwood.
4. Census tract 804 – Harrison Twp., off Riverside Drive.
5. Census tract 11 – Riverdale/North Riverdale neighborhood, Dayton.
6. Census tract 23 – Burkhardt neighborhood, Dayton.
7. Census tract 7 – Southern Dayton View, Dayton.
8. Census tract 702.01 – Southeast portion of Trotwood.
9. Census tract 20 – Springfield neighborhood, Dayton/Riverside.
10. Census tract 806 – Harrison Twp., Wagner Ford and I-75.
11. Census tract 8.01 – Hillcrest neighborhood, Dayton.
12. Census tract 1 – Northern Hills/Free Pike area.
13. Census tract 5 – Dayton View Triangle and area north of Good Samaritan Hospital.
14. Census tract 908 – Southeast corner of Riverside.
15. Census tract 39 – Southern half of Westwood neighborhood, Dayton.
16. Census tract 44 – Crown Point/Residence Park neighborhoods.
17. Census tract 705 – Trotwood north of Wolf Creek Pike/Main St.
18. Census tract 603 – Jefferson Twp./Dayton.
19. Census tract 704 – Trotwood south of Wolf Creek Pike/Main St.
20. Census tract 701.01 – All of western Trotwood.
Click on a census tract to see more details.
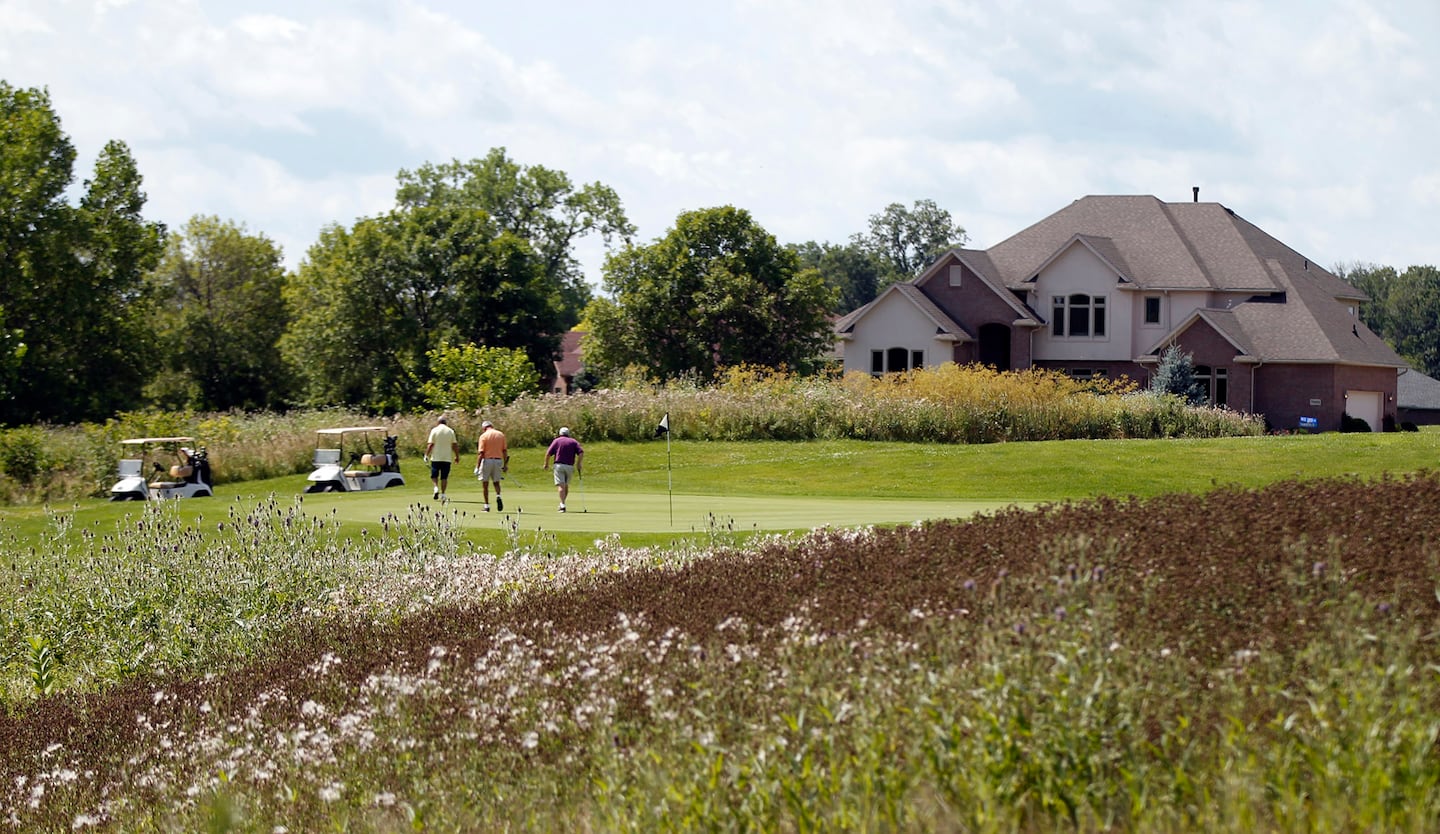
So where are the most loans being approved?
We looked at the five Dayton-metro census tracts with the most applications for conventional home mortgage loans in 2016. They are all affluent, white suburbs or townships and had loan denial rates below 11 percent.
1. Census tract 404.06 – Washington Twp./Centerville.
There were 299 loan applications and a denial rate of 8.7 percent. The census tract is 80 percent white and had a median home value of $267,700. The loan denial rate for Latinos in this census tract was disproportionally high at 12.5 percent.
2. Census tract 2106.03 – Beavercreek Twp.
There were 238 loan applications and a denial rate of 2.9 percent. The census tract is 86 percent white and has a median home value of $256,600.
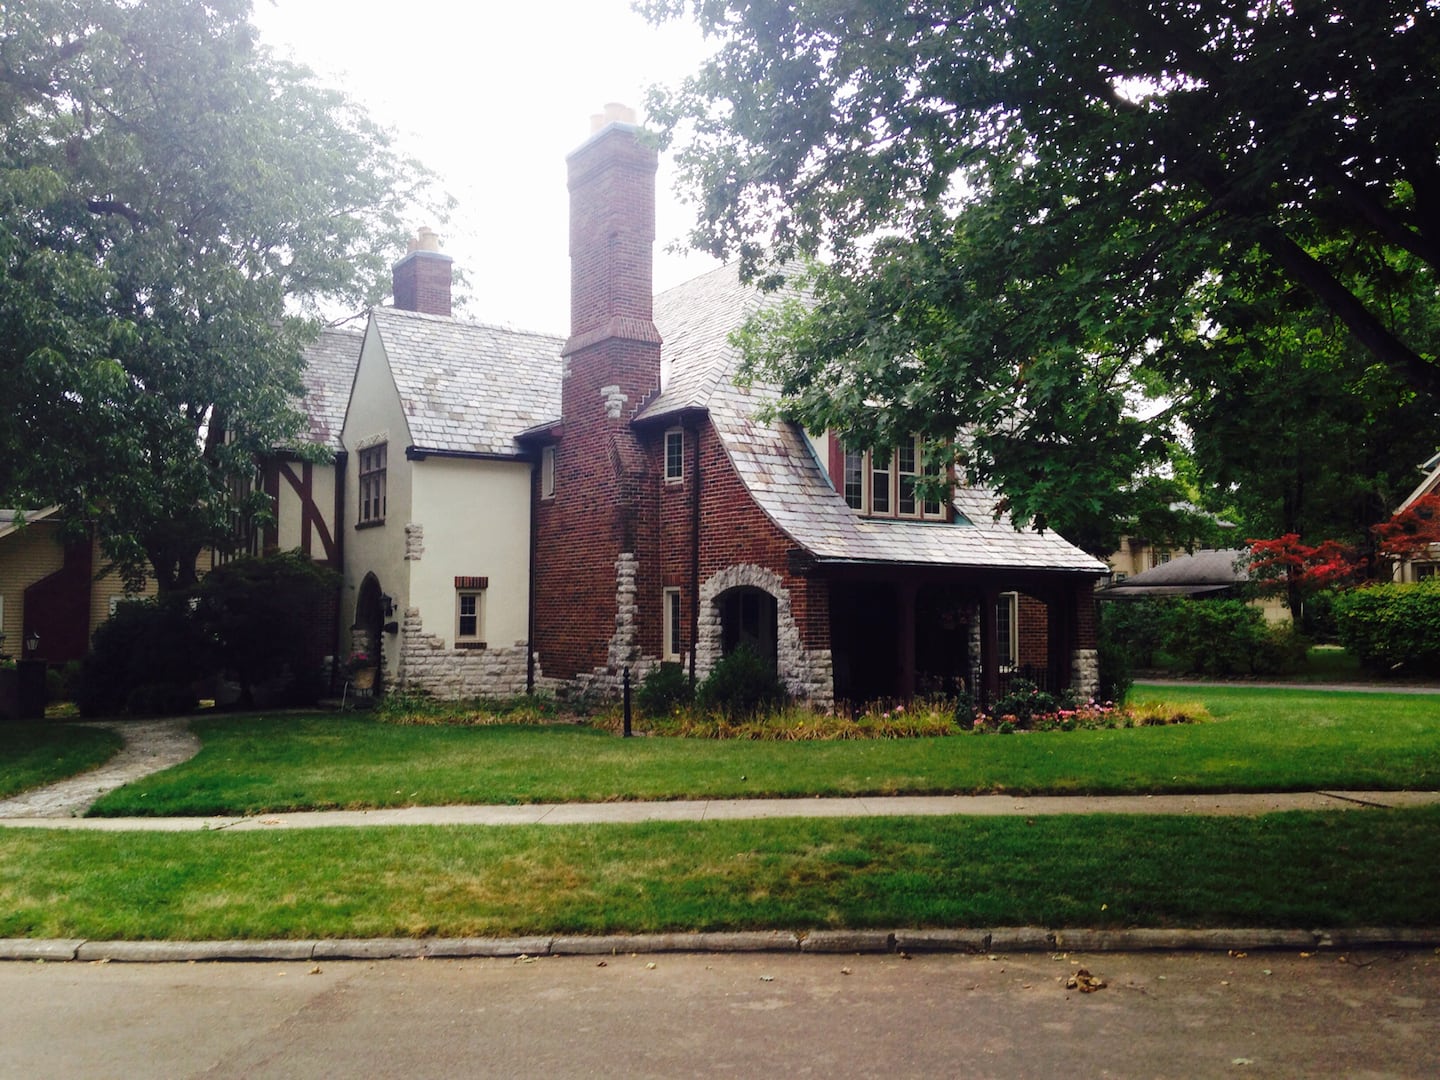
3. Census tract 102 – Eastern Oakwood.

There were 237 loan applications and a denial rate of 4.2 percent. The census tract is 95.6 percent white and has a median home value of $206,700.
4. Census tract 3801 – Bethel Twp., Miami County. There were 233 loan applications and a denial rate of 10.7 percent. The census tract is 93.6 percent white and has a median home value of $179,500.
5. Census tract 2201 – Bellbrook/Sugarcreek Twp.
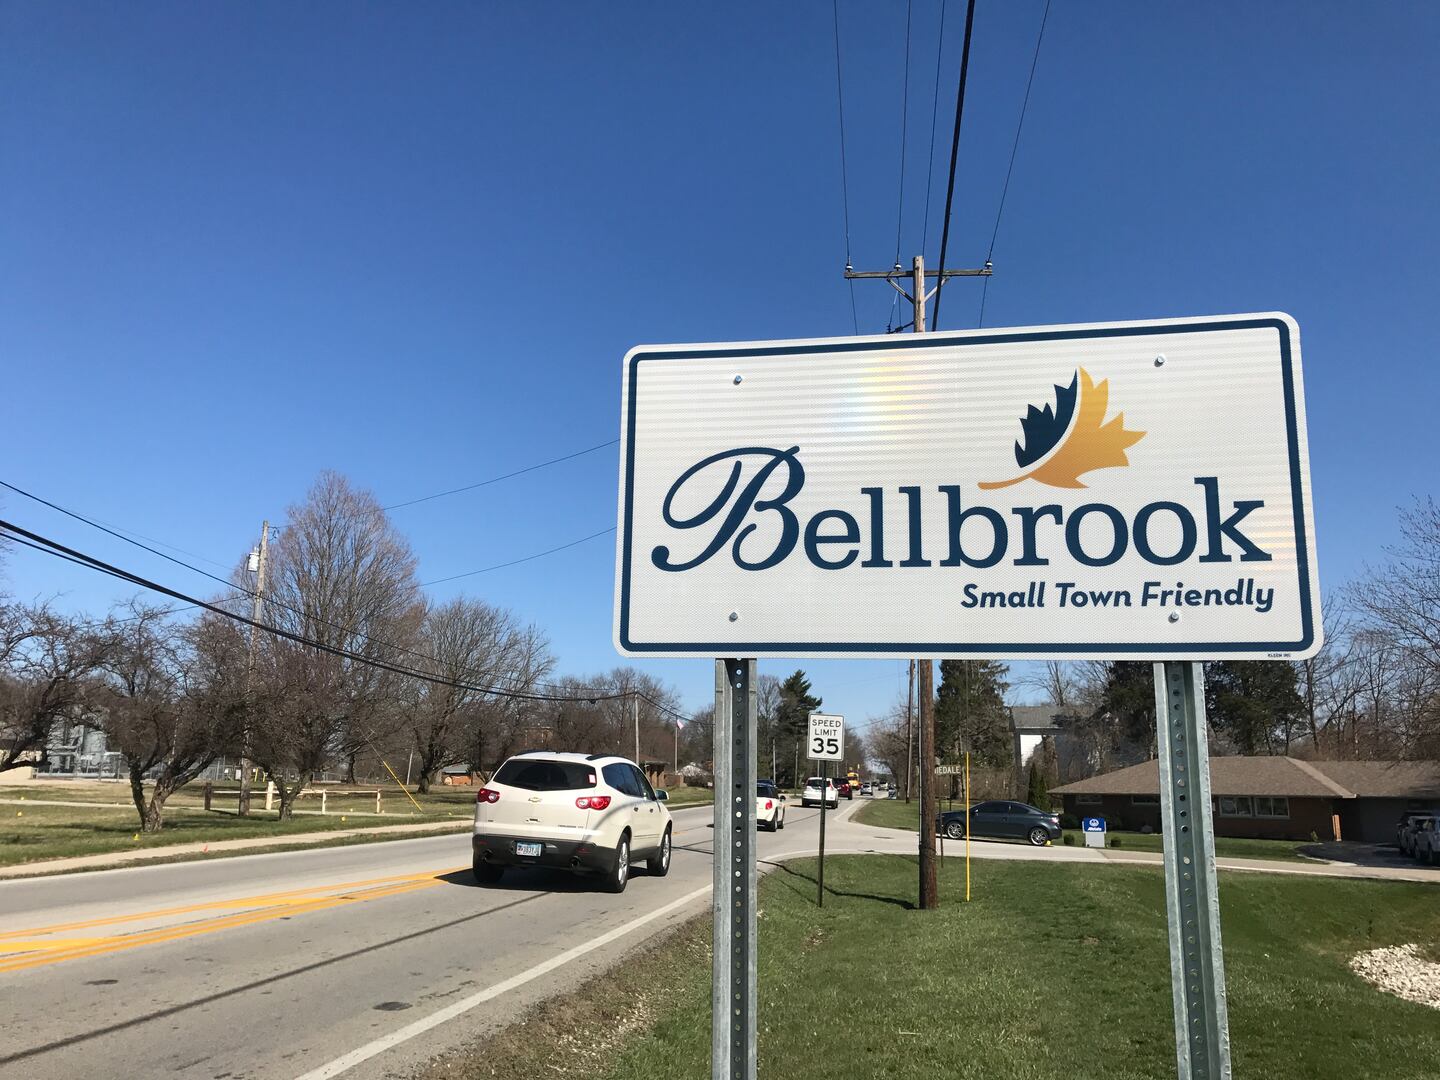
There were 228 loan applications and a denial rate of 9.2 percent. The census tract is 95 percent white and has a median home value of $304,500. The loan denial rate for Asians was disproportionally high in this census tract at 43 percent.
Read Reveal’s nationwide redlinging investigation here: For people of color, banks are shutting the door to homeownership


