Traffic

TRAFFIC ALERT: Right lane blocked due to garbage truck fire on I-75 NB in Montgomery Co.

Garbage truck fire on I-75 NB past Needmore Road Photo from: ODOT

Traffic issues can be reported by calling our newsroom at 937-259-2237 or tweeting @WHIOTraffic.

Major Highway Incidents

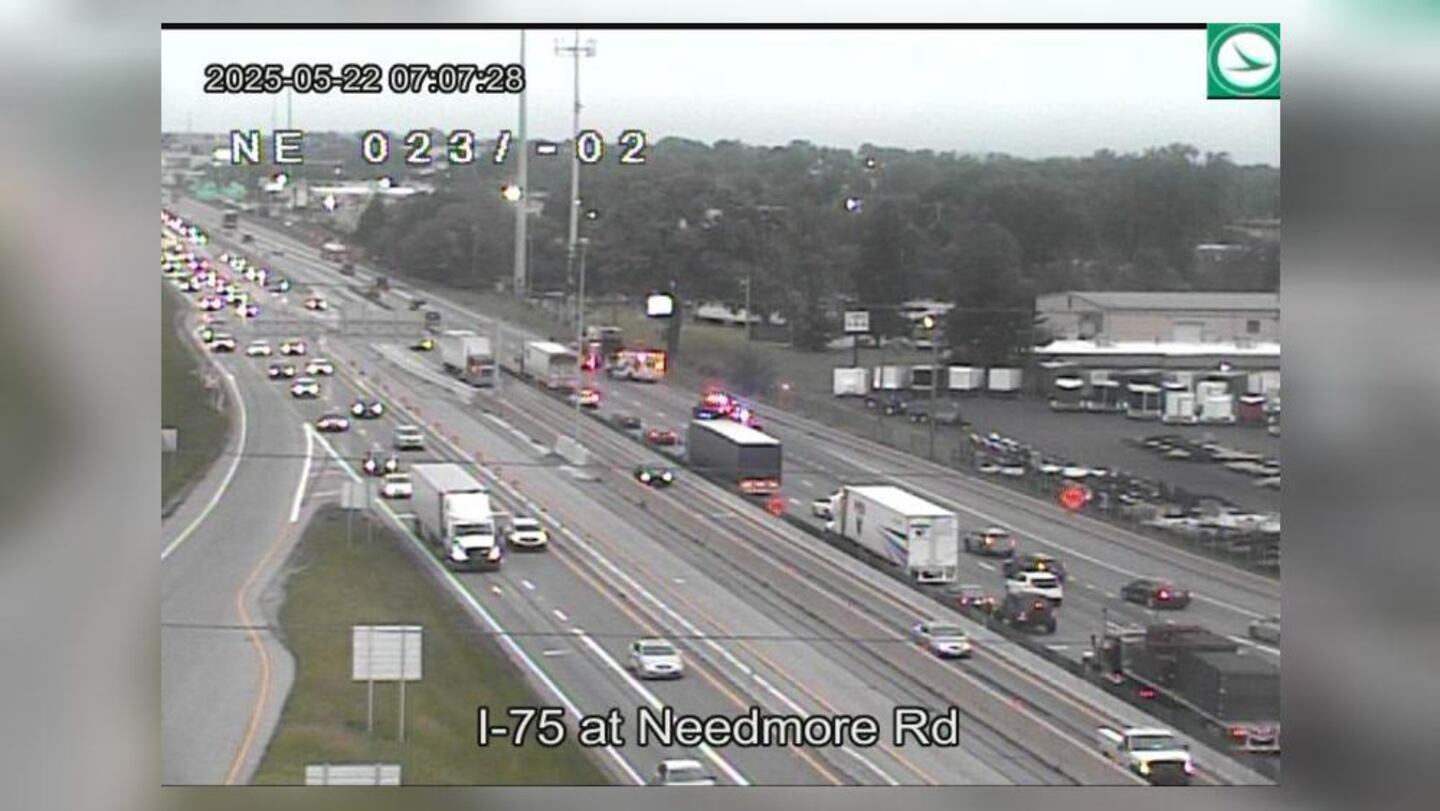
  • The right lane is blocked after a garbage truck fire on Interstate 75 Northbound past Needmore Road. ODOT cameras show fire trucks and medics are at the scene.

Street Incidents

  • No major incidents to report at this time.

Latest traffic conditions also are available on our traffic map

» RELATED: Track the latest weather conditions on our Live Doppler 7 HD Radar

Cheapest gas prices across the area according to GasBuddy.com:

Dayton Gas Prices provided by GasBuddy.com
Click here to add this map to your website.


Lowest Area Gas Prices

NOTE: Some locations report gas prices even when they are closed, under construction, or are otherwise not open for business. We recommend reaching out to a location to confirm they're open before making a trip.

Price Station Address City Time
2.510 Speedway
333 W Main St
333 W Main St Xenia Jun 12, 1:14 PM
2.530 Murphy USA
50 Hospitality Drive
50 Hospitality Drive Xenia Jun 12, 1:00 PM
2.530 United Dairy Farmers
340 W 2nd St
340 W 2nd St Xenia Jun 12, 8:29 AM
2.550 Casey's
1615 N Detroit St
1615 N Detroit St Xenia Jun 12, 11:45 AM
2.550 Speedway
738 N Detroit St
738 N Detroit St Xenia Jun 12, 6:12 AM
2.550 OM Oil
155 S Main St
155 S Main St Miamisburg Jun 11, 7:03 PM
2.570 BP
326 W MAIN ST
326 W MAIN ST Xenia Jun 12, 7:58 AM
2.590 Costco
5300 Cornerstone North Blvd
5300 Cornerstone North Blvd Centerville Jun 12, 1:07 PM
2.590 Sam's Club
3446 Pentagon Blvd
3446 Pentagon Blvd Beavercreek Jun 12, 12:46 PM
2.590 BP
102 BYERS RD
102 BYERS RD Miamisburg Jun 12, 12:08 PM
Dayton Gas Prices provided by GasBuddy.com


NATIONAL GAS PRICE AVERAGES
Current USA
Average

3.104
Regular Gasoline
Trend
Current Trend
HIGHEST
STATE

4.614
California
LOWEST
STATE

2.626
Mississippi
Fueled By GasBuddy.com
Find low Gas Prices at GasBuddy.com


Dayton Gas Prices provided by GasBuddy.com


Quick charts:   1 Month | 3 Month | 6 Month | 9 Month | 1 Year | 18 month | 2 Years | 3 Years | 4 Years | 5 Years | 6 Years
pricechart
Customize price charts
Area 1:Time Period:US $/G
Area 2:Show Crude Oil PriceCanadian c/L
Area 3:

Step One - Select a single city in order to identify price trends or to identify a historical price most accurately. Select multiple cities to compare pump prices between cities.

Step Two - Selection of time duration will define how long into history the prices will be displayed. In some cities only limited price history information is available and in those cases the line will be flat for extended periods.

Step Three - When comparing US cities to Canadian cities you have a choice of price units. The standard unit of measure in the US is dollars per gallon and in Canada the standard is cents/liter. Comparison of US and Canadian cities is done using recent currency exchange rates and uses the conversion factor of 1 US gallon being equal to 3.78 liters. For simple plotting of US cities use dollars per gallon ($/G) and for simple plotting of Canadian cities use cents/liter (c/L).
Dayton Historical Gas Price Charts Provided by GasBuddy.com
0