
US new home sales outlook: Housing market trends and what the latest data signals for 2026
A SoFi analysis of new home sales data suggests the U.S. housing market may be showing early signs of stabilization. Current indicators, including steadying interest rates and a gradual softening of new home sales prices, point to a potentially more consistent environment in 2026.
New home sales provide critical insight into the overall U.S. housing market. The data is telling of real estate market demand, which can impact mortgage interest rates and home prices. It’s also a leading indicator of broader economic stability.
This signal carries extra weight after years of housing market volatility. Not only have supply and demand fluctuated, but affordability concerns — often linked to high mortgage interest rates and rising sales prices — have made homeownership a significant challenge for many.
To determine what these shifts mean for 2026, SoFi paired the latest sales data with expert forecasts to assess what may lie ahead for the U.S. housing market.
Key Findings
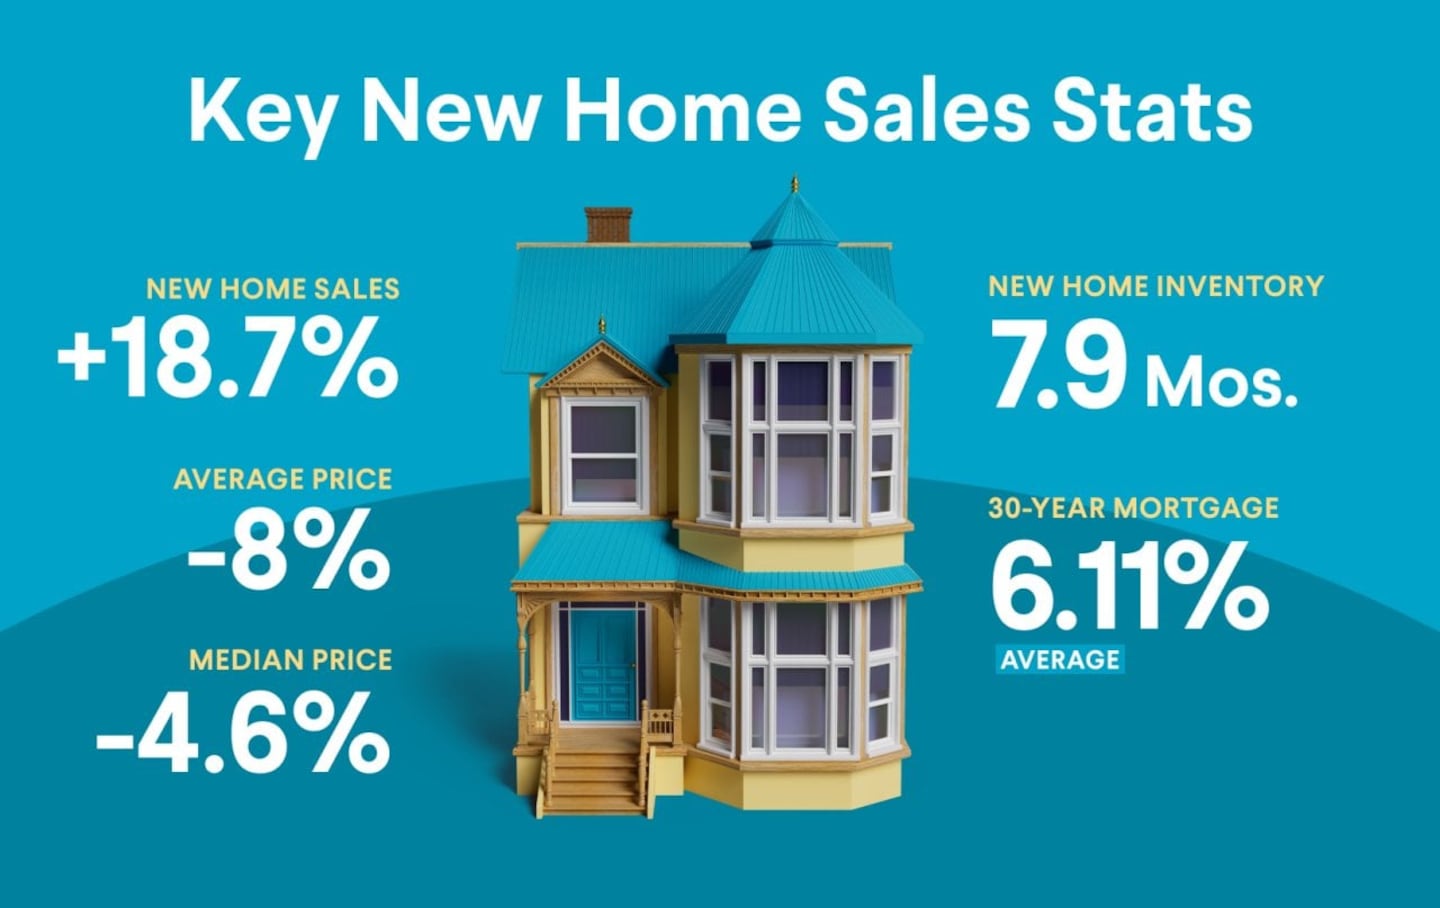
- New home sales are up 18.7% year-over-year (seasonally adjusted) as mortgage interest rates and inventory start to stabilize throughout many U.S. housing markets.
- A steady supply and demand for new homes is a strong indicator of a healthy economy. It can even provide valuable insight into individual financial stability.
- Median and average new home sales prices have slowly started to come down, and experts forecast a potential return to affordability in the coming years.
- Although the national housing market appears to be steadily improving in many ways, some regional and local markets show an opposite trend with declining inventory and sales rates.
- Factors such as new construction activity, new home supply, builder incentives, mortgage rates, and overall affordability can influence buyer behavior and the future of the U.S. housing market.
- If demand remains steady, the inventory of new homes for sale is predicted to last just under eight months (seasonally adjusted).
- In early 2026, SoFi analyzed the latest data from authoritative sources to make predictions about the U.S. housing market.
SoFi
Latest US New Home Sales Data and Housing Market Conditions
New Home Sales Activity
According to estimates from the U.S. Census Bureau and the U.S. Department of Housing and Urban Development (HUD), new single-family home sales were running at an annualized pace of 737,000 (a seasonally adjusted estimate of monthly sales projected over a full year). That’s just 0.1% lower than the new home sales rate the month before, suggesting that sales activity has largely stabilized rather than experiencing sharp month-to-month swings. Figures are seasonally adjusted to eliminate short-term factors that affect the data, such as climate, holidays, and production cycles.
While the month-to-month changes are negligible, the annual difference is much higher. The seasonally adjusted sales rate of new homes in October 2024 was 621,000. That’s an 18.7% year-over-year (YoY) increase.
Trends in New Home Sales Prices
As the overall new home sales rate rose, median sales prices fell. In the 12 months ending in October 2025, the median sales price of new homes dropped from $426,300 to $392,300. That’s an 8% YoY decline.
It’s worth noting that the average sales price of new homes rose 3% from September to October last year (from $483,500 to $498,000). However, there’s been an overall YoY decline — down 4.6% from October 2024, when the average new home sales price was $521,900.
New Home Inventory Levels
On the inventory side, the U.S. housing market hasn’t seen a significant change in inventory of late. In both September and October of last year, an estimated 488,000 new homes were on the market (seasonally adjusted). That reflects a 1.7% YoY increase.
So, what do these shifts indicate about the current housing market balance? For starters, the available inventory of new U.S. homes for sale was expected to last 7.9 months as of October 2025 (seasonally adjusted). In other words, if homes kept selling at the current pace and no new inventory came onto the market, it would take 7.9 months to sell every available home.
This figure falls short of estimates from earlier in the year. According to the U.S. Census Bureau, the supply of new homes was projected to last 8.9 months at the end of February 2025 and 9.2 months at the end of July. Still, supply hasn’t changed much since the tail end of last year. And new home inventory levels are also on par with the July 2024 estimate of 7.9 months.
When supply remains steady to meet demand, it’s a good indicator of a healthy economy. It also keeps housing prices from skyrocketing.

SoFi
Behind the Numbers
The rising number of new home sales also suggests more buyers and sellers are on the market. This could reflect anything from builder incentives to the availability of low down payment mortgage options (like Federal Housing Administration or VA loans). Of course, housing doesn't exist in a vacuum. Increased demand may also indicate greater individual economic stability. There could be regional or local variances at play here, however, as the national unemployment rate was 4.4% in February 2026. How this might affect the national housing market for the year remains to be seen.
Regional and Metro-Level New Home Sales Trends
National new home sales trends are useful, but they don’t tell the whole story. Regional and metro-level data can reveal much more about what’s happening on the ground.
Redfin Data Center found that home sales across all residential property types rose slightly from 432,467 in January 2025 to 435,735 in December 2025. That's less than a 1% difference. But demand for these types of homes has cooled in the following major metropolitan areas:
- Washington, D.C.: 4,669 to 4,464 (-4.39%)
- Philadelphia: 1,670 to 1,634 (-2.16%)
- Seattle: 2,938 to 2,816 (-4.15%)
- Chicago: 6,536 to 6,374 (-2.48%)
The housing market also varies regionally. Every year, the HUD Office of Policy Development and Research publishes Comprehensive Housing Market Analysis reports on major U.S. regions. Key data from the latest reports (second quarter 2025) include the following.
New England (Connecticut, Maine, Massachusetts, New Hampshire, Rhode Island, Vermont):
- The housing supply in every state except for Vermont was below the national level.
- New and existing home sales fell 2% from May 2024 to May 2025. New construction properties (single-family) also declined.
Mid-Atlantic (Delaware, D.C., Maryland, Pennsylvania, Virginia, West Virginia):
- The region saw a 7% increase in home sales prices, while homebuilding activity fell 10%.
- Housing inventory was estimated to last 2–4.9 months.
Southwest (Arkansas, Louisiana, New Mexico, Oklahoma, Texas):
- Home sales decreased in all states, with a notable 11% decline in Texas.
- The permitting of new single-family homes in the broader Southwest region fell 6% YoY.
Northwest (Alaska, Idaho, Oregon, Washington):
- The number of single-family homes permitted fell 3% YoY, with Oregon seeing the greatest decline in new home construction (down 9%).
- Home sales within the region fell 1% YoY compared with 11% YoY in 2024.
The U.S. housing market is somewhat of a mixed bag. While new construction inventory, sales rates, and prices might be relatively stable in one region, the opposite can be true elsewhere.
If you're considering buying a home in 2026, awareness of regional and local housing market differences can help. An area with rising new home sales could indicate more affordable prices (and mortgage rates) and potentially higher inventory levels. It might also suggest broader economic stability — not just in employment and job growth rates, but also in income levels.
What’s Driving New Home Sales and the Housing Market Into 2026?
Several forces shape the trajectory of new home sales. Some work in buyers’ favor, while others create headwinds.
Mortgage Rates
Since mortgage rates so directly affect affordability, they also figure heavily into people’s buying decisions. As of February 2026, the average 30-year fixed-rate mortgage was 6.11% (or 5.50% for a 15-year fixed-rate loan). Rates have climbed dramatically since their 2021 lows of under 3.00%, but the broader trend over the past year has been downward. For reference, 30-year rates hit 7.79% in October 2023.
Listing Prices
As noted earlier, average and median new home sales prices have been trending downward of late, with the median dropping 8% YoY as of October 2025. If recent trends continue, 2026 could be the year that sidelined buyers can make a move.
Builder Incentives
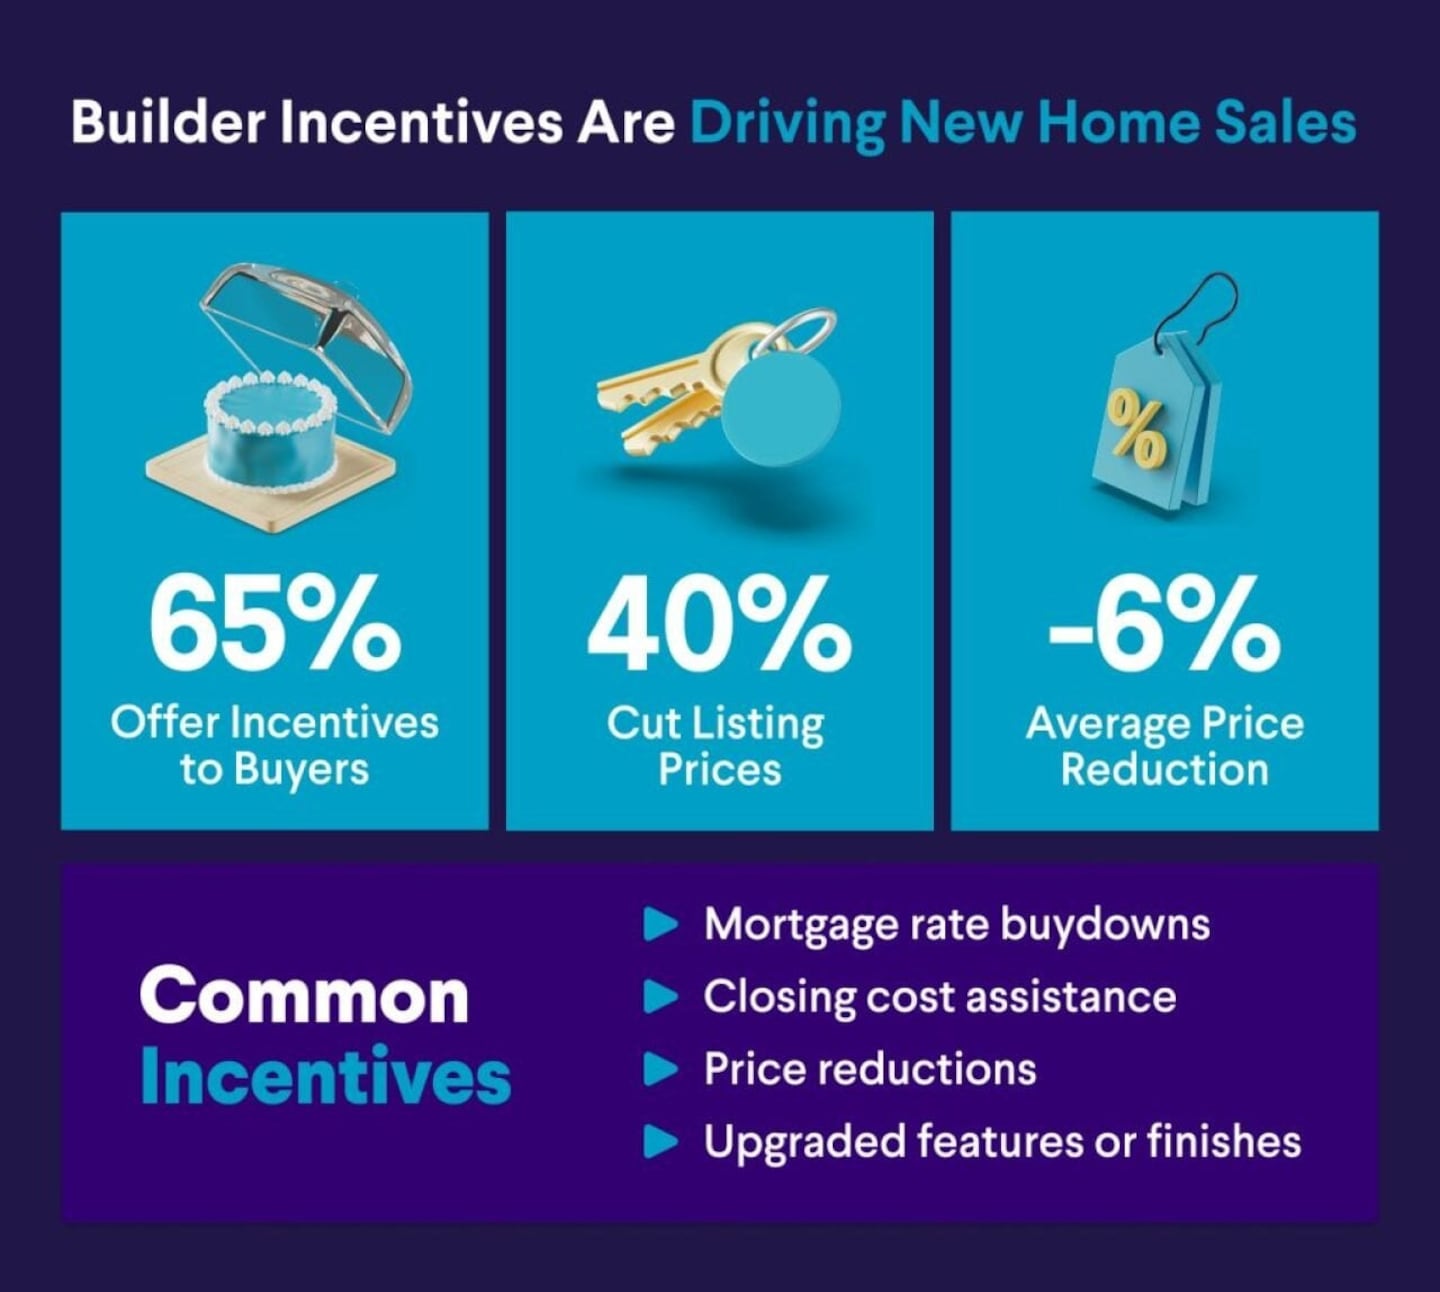
Builder incentives have become a widespread tactic to keep sales moving. According to the National Association of Home Builders (NAHB), 65% of builders reported using sales incentives in January 2026, marking the 10th consecutive month that incentive use has exceeded 60%. These incentives include mortgage rate buydowns, closing cost assistance, and other buyer-facing concessions.
Beyond incentives, builders are also adjusting on price. The same survey found that 40% of builders reported cutting listing prices in January. The average price reduction was 6%, up from 5% in December.
SoFi
Builder Sentiment
Confidence among new single-family homebuilders fell two points in January to 37 out of 100, according to the NAHB. This is especially concerning for lower- and mid-range sectors of the housing market. In 2024 and 2025, builders experienced (or expected to experience) challenges regarding high interest rates, rising inflation and material costs, and other economic issues. Some of these pressures, like interest rates, could ease in 2026.
Construction Activity
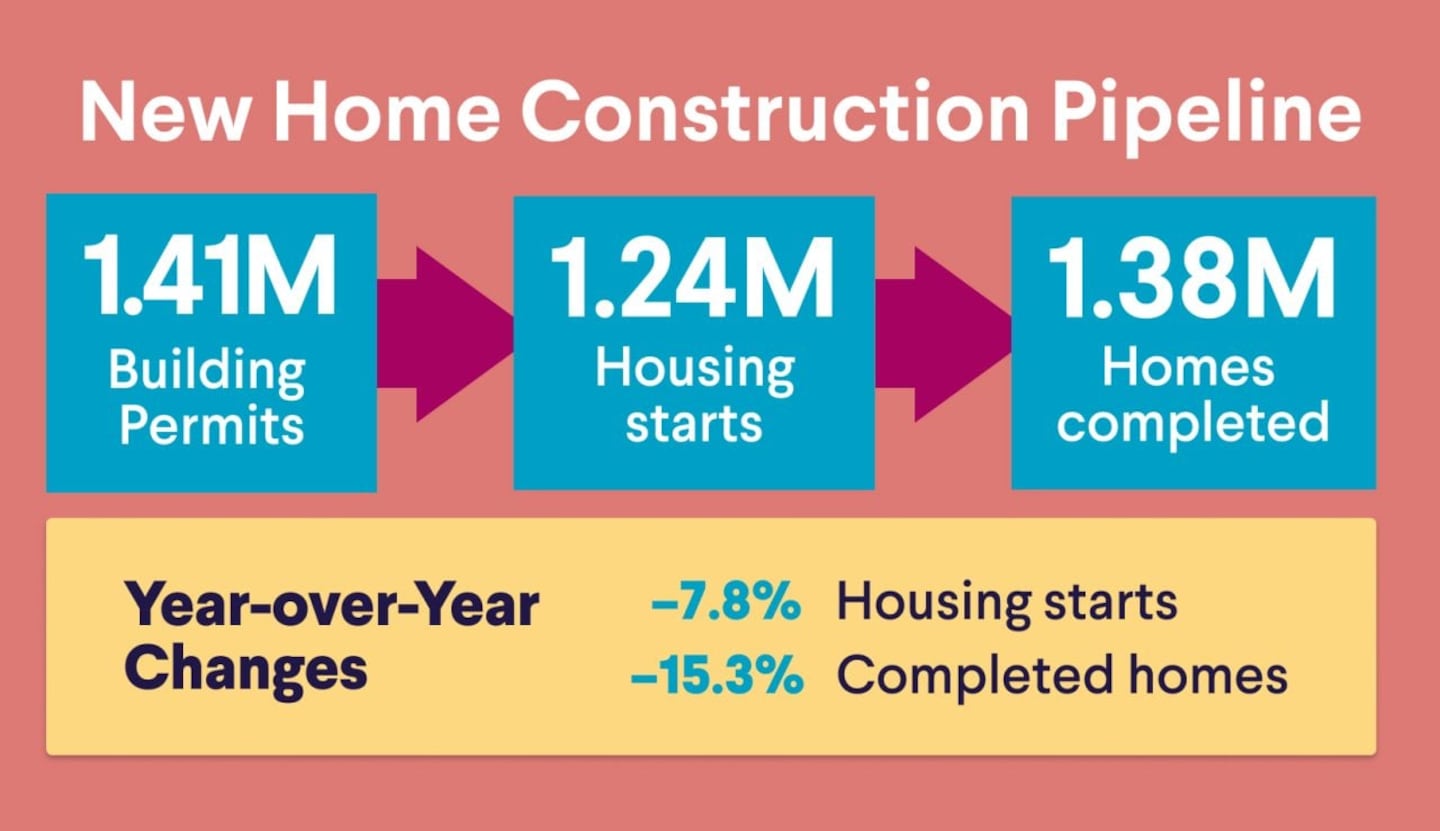
As of October 2025, there were 1,412,000 building permits (for future construction) and 1,246,000 housing starts (new construction) for privately owned housing units. The number of completed units was 1,386,000.
However, it’s worth noting that housing starts and completed construction fell below prior-year rates (down 7.8% and 15.3%, respectively). This points to a lower-than-expected supply.
SoFi
Buyer Behavior
A number of economic forces shape buyer behavior. For example, inflationary pressure that drives up building costs can translate to more expensive homes, keeping people from entering the market.
Employment rates and income play a role, too. The national unemployment rate was 4.4% in December 2025, up 0.4% from the beginning of the year. It dropped to 4.3% in January. Higher unemployment rates typically dampen housing demand.
2026 New Home Sales Outlook and Housing Market Forecast: The Short-Term Forecast
Sales
According to Fannie Mae's Economic and Strategic Research Group, new single-family home sales are projected to rise approximately 3.7% YoY in 2026. Sales are then expected to increase slightly in 2027, with a projected 0.6% gain.
Total home sales are projected to rise approximately 2.7% in 2026, followed by stronger growth in 2027, signaling a gradual recovery rather than rapid expansion.
In 2026, total home sales are expected to reach approximately 4.9 million, including roughly 707,000 new single-family home sales. That’s modestly above 2025 levels, despite ongoing affordability concerns.
Inventory
On the supply side, Fannie Mae projects total housing starts to decline 3.7% in 2026, driven by a 3% drop in single-family starts and a 5.2% decline in multifamily starts. Starts are in line for a modest recovery in 2027, with a projected increase of 2.2%.
Mortgage Rates and Originations
Mortgage rates continue to be a factor heading into 2026, but Fannie Mae’s outlook is somewhat positive. Rates are expected to hover at around 6.00% for a 30-year mortgage, much as they did throughout most of 2025. If rates hold steady and housing prices decline both nationally and regionally, more buyers could feel confident entering or returning to the market.
While single-family mortgage originations are off to a slow start in 2026, Fannie Mae predicts a rebound as the year progresses. This suggests greater buyer engagement may be on the horizon.
Broader Pricing and Affordability Trends
Home prices are still rising, but the pace is cooling. According to HUD, annual price growth ranged from 1.8% to 2.3% in July 2025, down from higher gains earlier in the year. First American Data & Analytics put in sharper context, reporting that annual home price appreciation has hit its slowest growth rate since 2012. If this continues, housing affordability could improve, especially in areas with higher inventory levels.
Looking further ahead, the Mortgage Bankers Association (MBA) expects sales activity to increase over the next 25 years. Demographics drive that prediction, as millennials and Gen Z move toward major life milestones like big moves, job transitions, and growing families, all of which have historically driven homeownership demand.
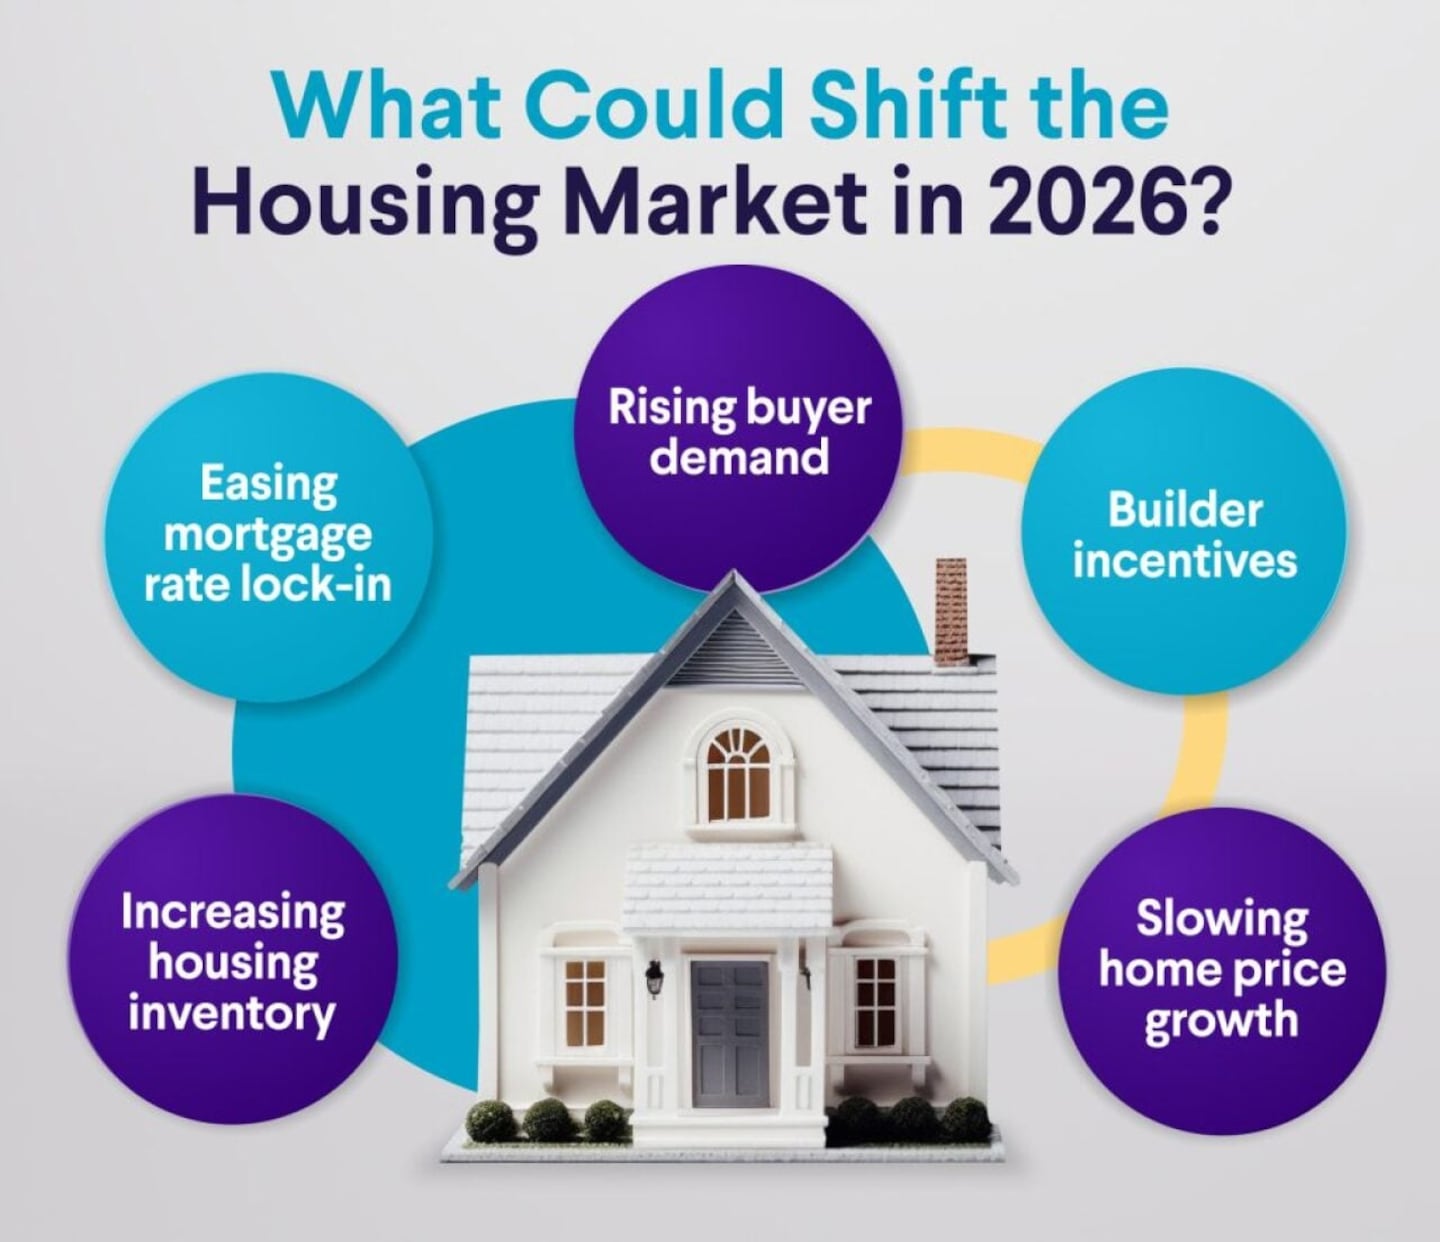
What Could Shift the Balance
One factor that could influence supply is the potential easing of rate lock-in. Homeowners sitting on sub-4.00% mortgages have had little financial reason to sell, keeping existing homes on the market.
But if interest rates gradually decline, that math would change. And if more existing inventory comes online alongside new construction (new single-family home sales were already up 18.7% in September 2025), buyers could see more options. Ultimately, the 2026 housing market might not go back to “normal,” but it appears to be moving toward a healthier balance.
SoFi
What New Home Sales Trends Mean for Homebuyers in 2026
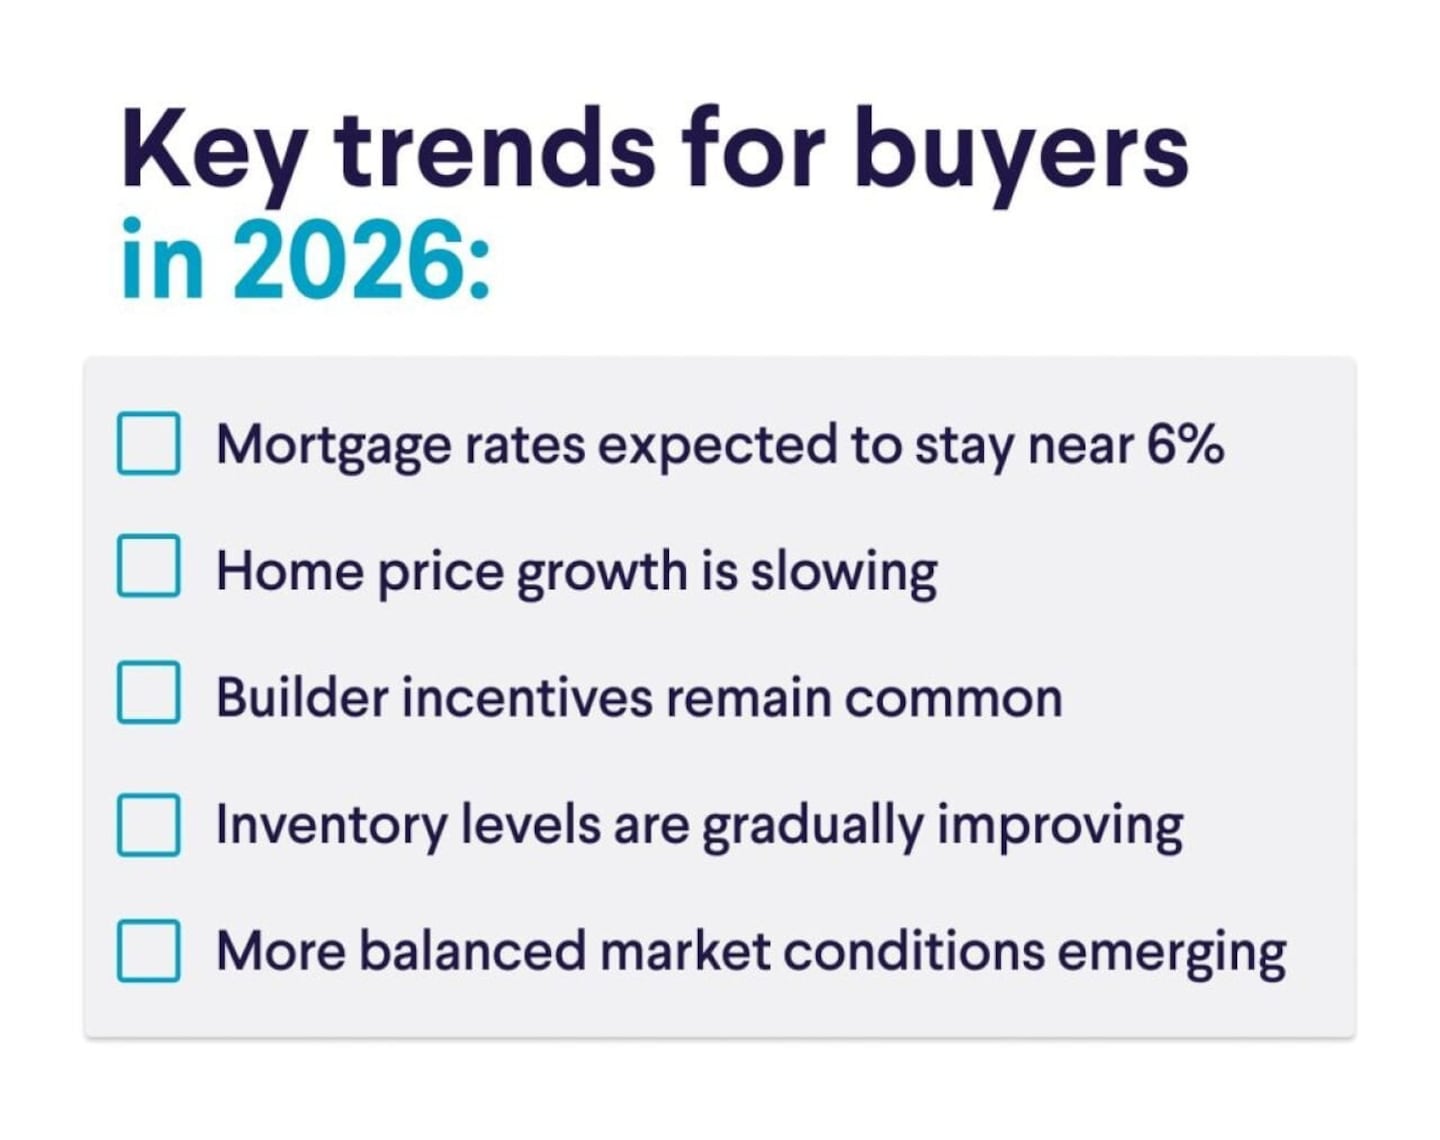
The data points toward a housing market that’s gradually becoming more accessible. Mortgage rates are expected to hold near 6.00%, home price appreciation is slowing to its lowest rate in over a decade, and builder incentives remain widespread.
Buyers shouldn’t expect dramatic corrections, but the trends are encouraging. Higher inventory and cooling prices are bringing the market closer to balance. And that’s good for sellers, too, since price stability tends to support more consistent demand.
For returning and first-time homebuyers alike in the market for new construction, the current environment shows reason for optimism. Builder incentives like rate buydowns and closing cost assistance can help lower the purchase price. And buyers who are flexible on location may also find more favorable conditions in nearby markets with higher inventory.
SoFi
Methodology and Data Sources for New Home Sales Analysis
Accuracy and transparency matter. That’s why SoFi relies on authoritative primary and reputable third-party sources to procure and analyze data — in this case, U.S. housing market trends and predictions.
This new home sales data analysis is fundamentally based on the latest available housing market data from 2025 and early 2026. Core data sources for regional and metro insights, market trends, affordability, and forecasting include the U.S. Census Bureau/HUD, Federal Reserve Economic Data (FRED), Redfin, Freddie Mac, Fannie Mae, MBA, and NAHB.
Note: Some data includes both new and existing home sales. This is due either to limited data on the former or blended data in original reporting. A few figures come from Q4 2024 for added context.
The Takeaway
The broad picture heading into 2026 is one of gradual improvement, not a dramatic reset. New home price growth has moderated, and mortgage rates are projected to remain relatively stable. While supply constraints persist in some regions, conditions appear more balanced than in recent years.
FAQs
What are new home sales, and how are they different from existing home sales?
The U.S. Census Bureau defines new home sales as the signing of a sales contract or acceptance of a deposit on a property at any stage of development (not started, under construction, or completed). An estimated 25% of these homes are sold at the time of completion, while the remainder are split between those not yet started and currently under construction.
Existing home sales work differently. They’re based on closings rather than purchase agreements. They usually involve a sales contract signed 30–60 days prior to being reported.
Why are new home sales important for understanding the housing market?
New home sales data is typically available one or two months before existing sales, making it a leading indicator of broader economic activity. It offers an early read on housing demand, buyer confidence, and pricing trends, though it tends to be more volatile than existing home sales data.
What does the latest new home sales data suggest about the 2026 housing market?
The data suggests a housing market that’s gradually moving toward better balance. Home price growth is moderating, mortgage rates are expected to hold relatively steady, and new home sales activity is projected to rise modestly in 2026.
How do mortgage rates affect new home sales?
Lower mortgage rates tend to bring more buyers into the market, while higher or volatile rates often push potential buyers to the sidelines until conditions stabilize.
Are new construction homes becoming more affordable?
While there are regional differences, new home prices have come down. The median sales price fell 8% YoY (from October 2024 to 2025). The average sales price fell 4.6% during this same period.
Which regions are seeing the strongest new home sales trends?
New home construction rates have fallen in certain areas, like Oregon, Idaho, Arkansas, and Delaware. In Vermont, the housing supply remained above the national level. Meanwhile, some Western and Southern housing markets have seen overall higher active inventories due to slower markets.
Is 2026 a good time to buy a new construction home?
It depends on your budget and needs. Buying a home is a major decision (and commitment), so take the time to consider whether it fits into your big-picture plans. Be sure to weigh the costs as well — not just financial. You’ll want to be emotionally and mentally prepared, too.
Where does new home sales data come from?
SoFi uses data from reliable primary and third-party resources. This includes organizations like the Census Bureau/HUD, Freddie Mac and Fannie Mae, Mortgage Bankers Association Forecasts (MBA), and the National Association of Home Builders (NAHB).
How does new home inventory affect housing prices and buyer competition?
Greater supply can keep up with high demand, but the inverse is also true. When there isn’t enough inventory, buyer competition can be fierce. Sometimes, housing prices will rise, and sellers will be less willing to negotiate with prospects.
This story was produced by SoFi and reviewed and distributed by Stacker.


