
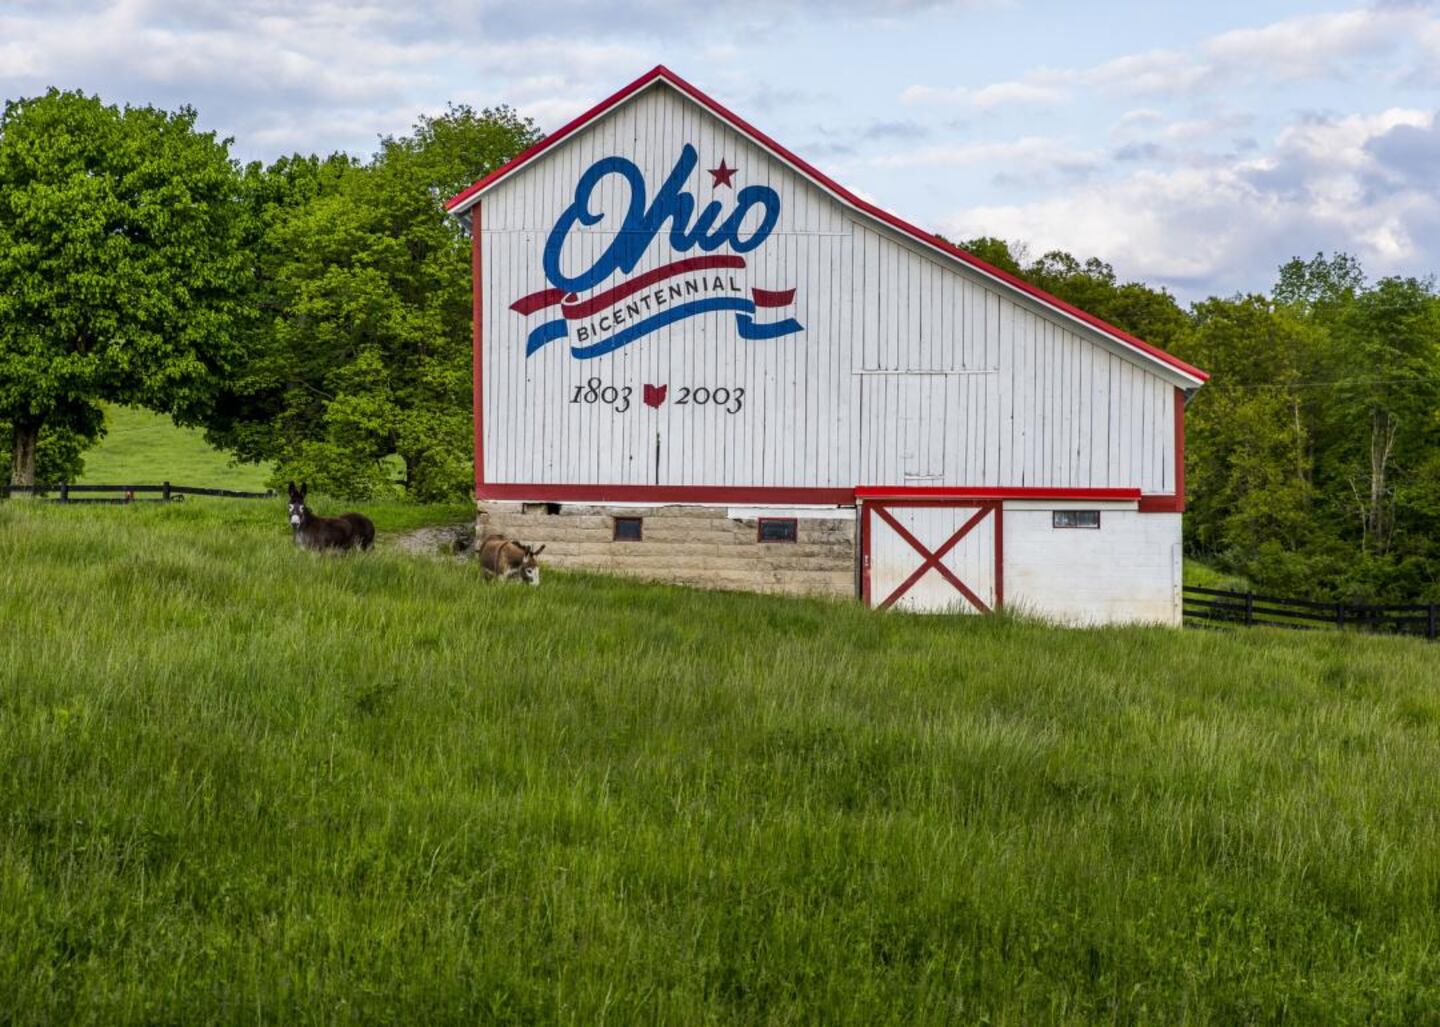
Life expectancy can be affected by a variety of factors. About 25% of your lifespan is determined by genetics, according to the National Library of Medicine. Health and wellness habits—like following a balanced, nutrient-rich diet; not smoking; drinking minimal alcohol; maintaining a healthy weight; and staying physically active—can add more than a decade to your life, research from the National Institutes of Health shows. While these factors are significant, another important element that you might not have considered is your environment and community.
While life expectancy generally increases annually in the United States—jumping from about 70.8 years old to 77.5 between 1970 and 2022, according to the Centers for Disease Control and Prevention—this particular metric can vary from state to state or even county to county. In some parts of the country, the average lifespan is getting shorter based on a variety of risk factors on top of health, including socioeconomic factors like poverty, unemployment, income, and education.
According to a 2020 study from researchers at Penn State, West Virginia, and Michigan State Universities, communities with a higher population density, more fast food restaurants, and a high number of extraction industry-based jobs tend to have shorter life expectancies.
To find out how life expectancy varies within Ohio, Stacker used 2024 County Health Rankings & Roadmaps from the University of Wisconsin Population Health Institute to identify the counties with the shortest life expectancy. Life expectancy measures the average number of years from birth a person can expect to live and is calculated based on the number of deaths in a given time period and the average number of people at risk of dying during that period. Counties with unreliable or insufficient data were excluded from the analysis. Mortality data came from the National Vital Statistics System.
Read on to see if your county is on the list.

Canva
#42. Shelby County (tie)
- Life expectancy: 75.6 years
--- Same as state average

Aiwilliams // Shutterstock
#42. Carroll County (tie)
- Life expectancy: 75.6 years
--- Same as state average

BLAZE Pro // Shutterstock
#41. Stark County
- Life expectancy: 75.4 years
--- 0.2 years lower than the state average

BLAZE Pro // Shutterstock
#39. Tuscarawas County (tie)
- Life expectancy: 75.3 years
--- 0.3 years lower than the state average

Big Joe // Shutterstock
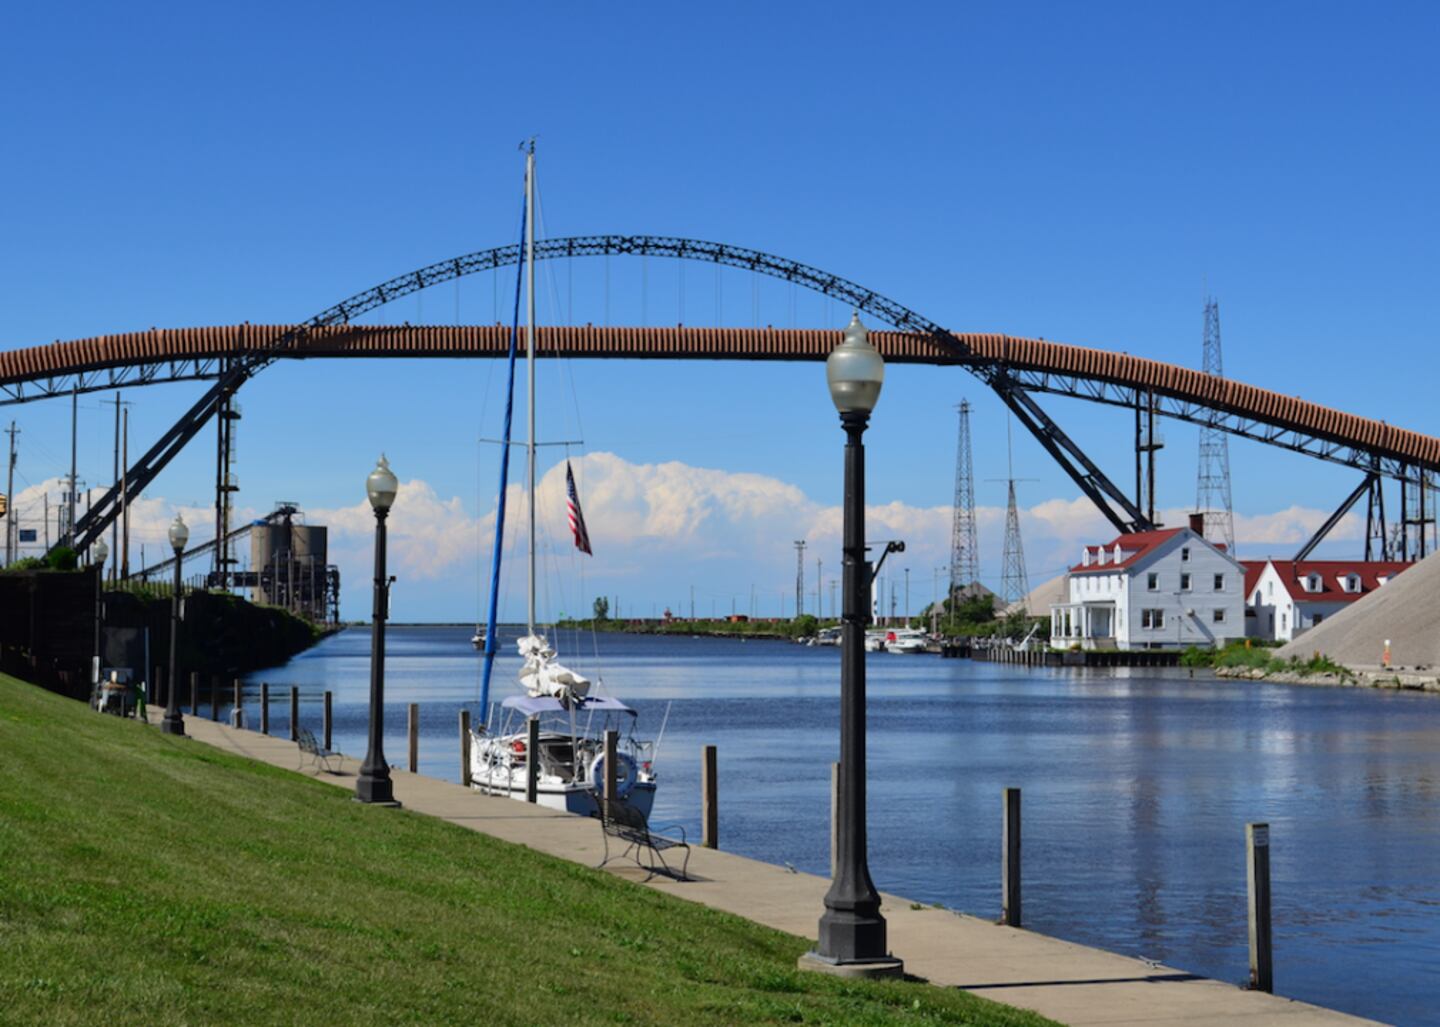
#39. Erie County (tie)
- Life expectancy: 75.3 years
--- 0.3 years lower than the state average

Bravo Charlie Productions // Shutterstock
#37. Allen County (tie)
- Life expectancy: 75.2 years
--- 0.4 years lower than the state average

Henryk Sadura // Shutterstock
#37. Sandusky County (tie)
- Life expectancy: 75.2 years
--- 0.4 years lower than the state average

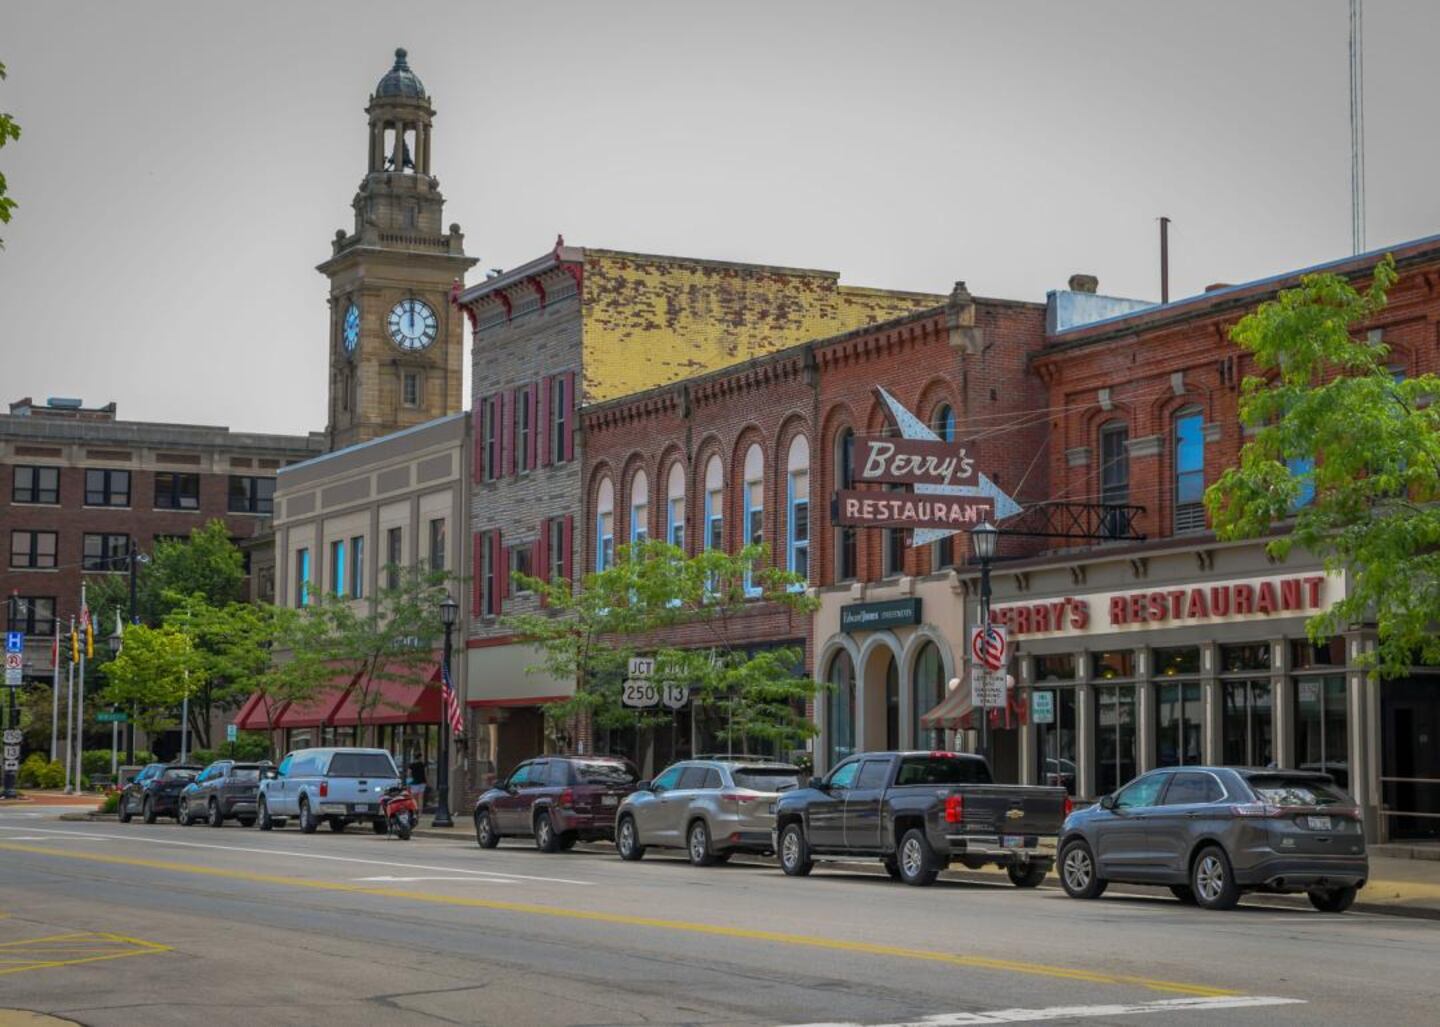
Donna Wickerham // Shutterstock
#36. Richland County
- Life expectancy: 74.7 years
--- 0.9 years lower than the state average

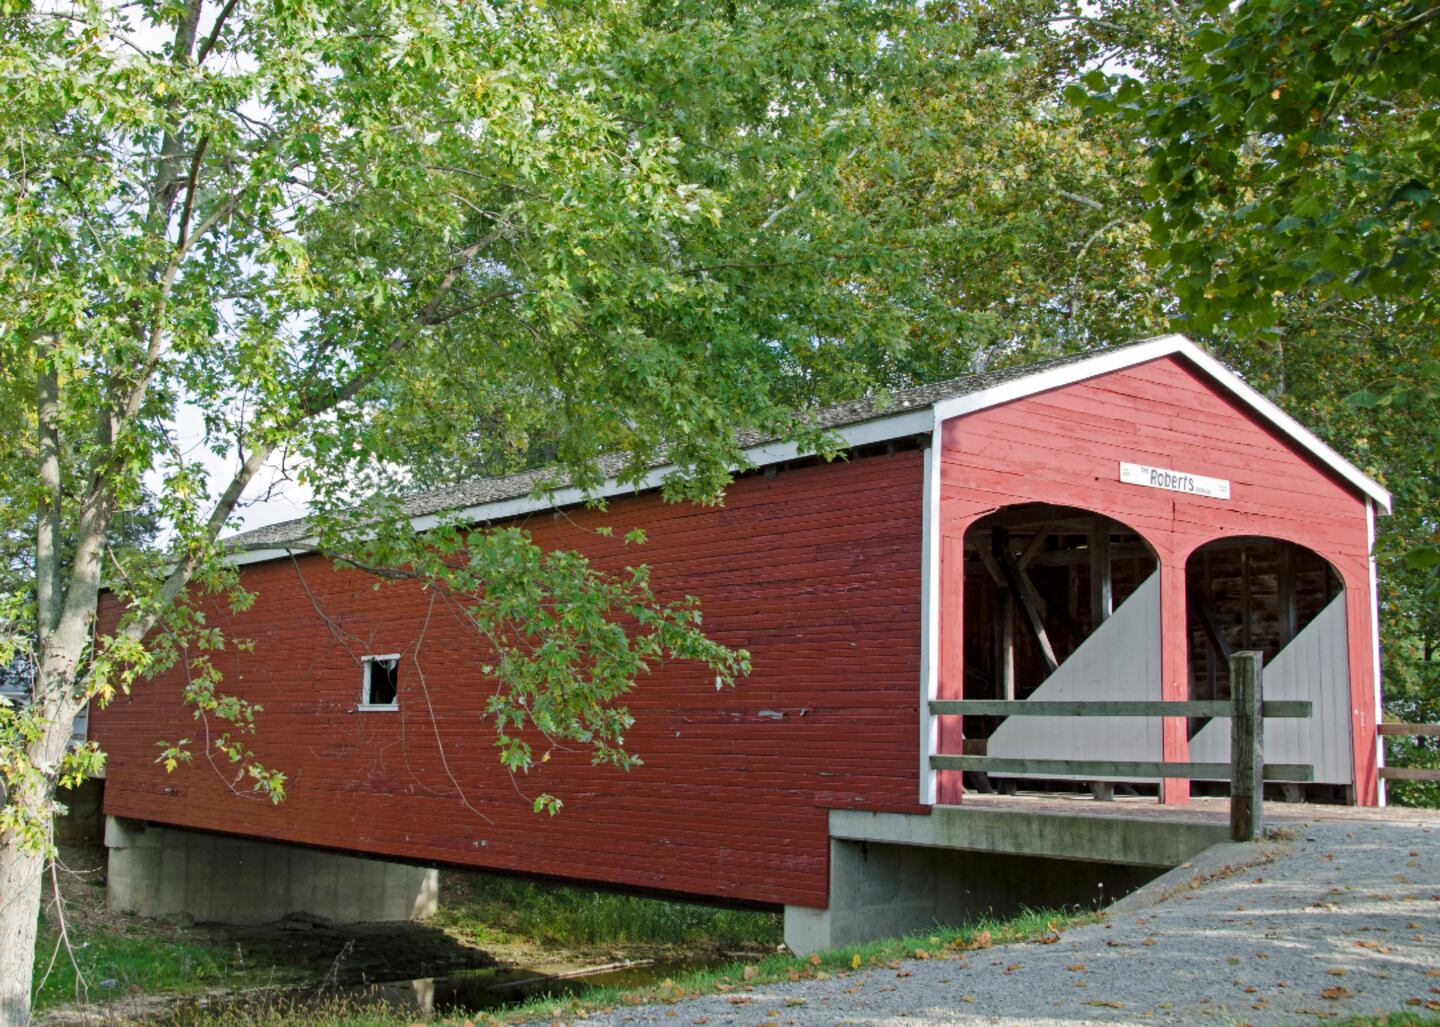
JNix // Shutterstock
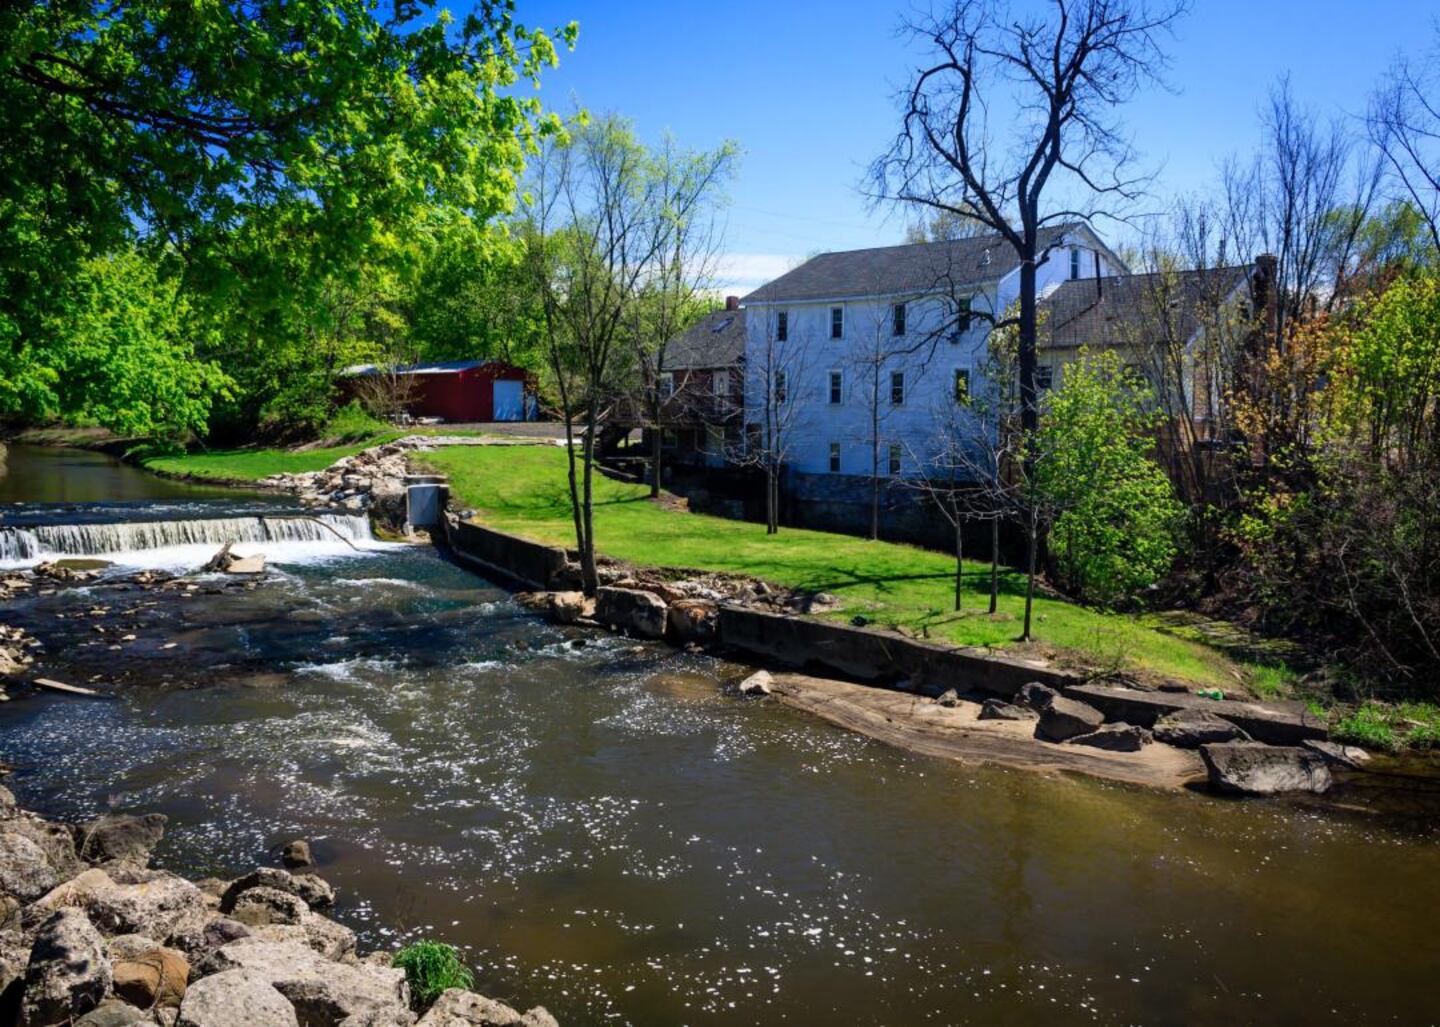
#34. Belmont County (tie)
- Life expectancy: 74.6 years
--- 1.0 years lower than the state average
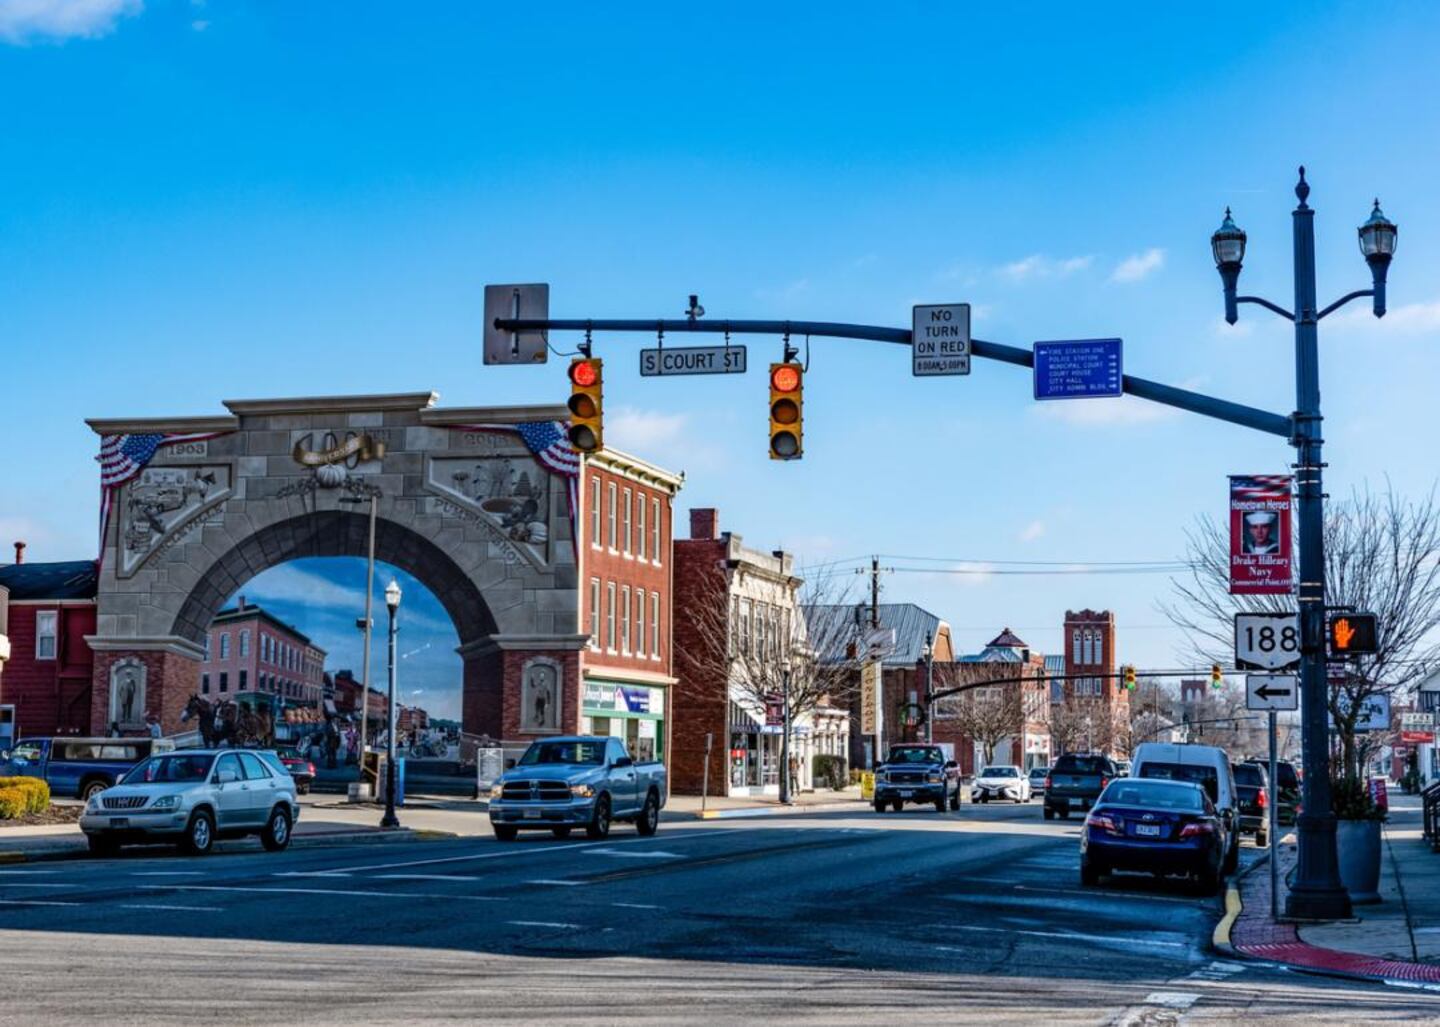
Keith J Finks // Shutterstock
#34. Huron County (tie)
- Life expectancy: 74.6 years
--- 1.0 years lower than the state average

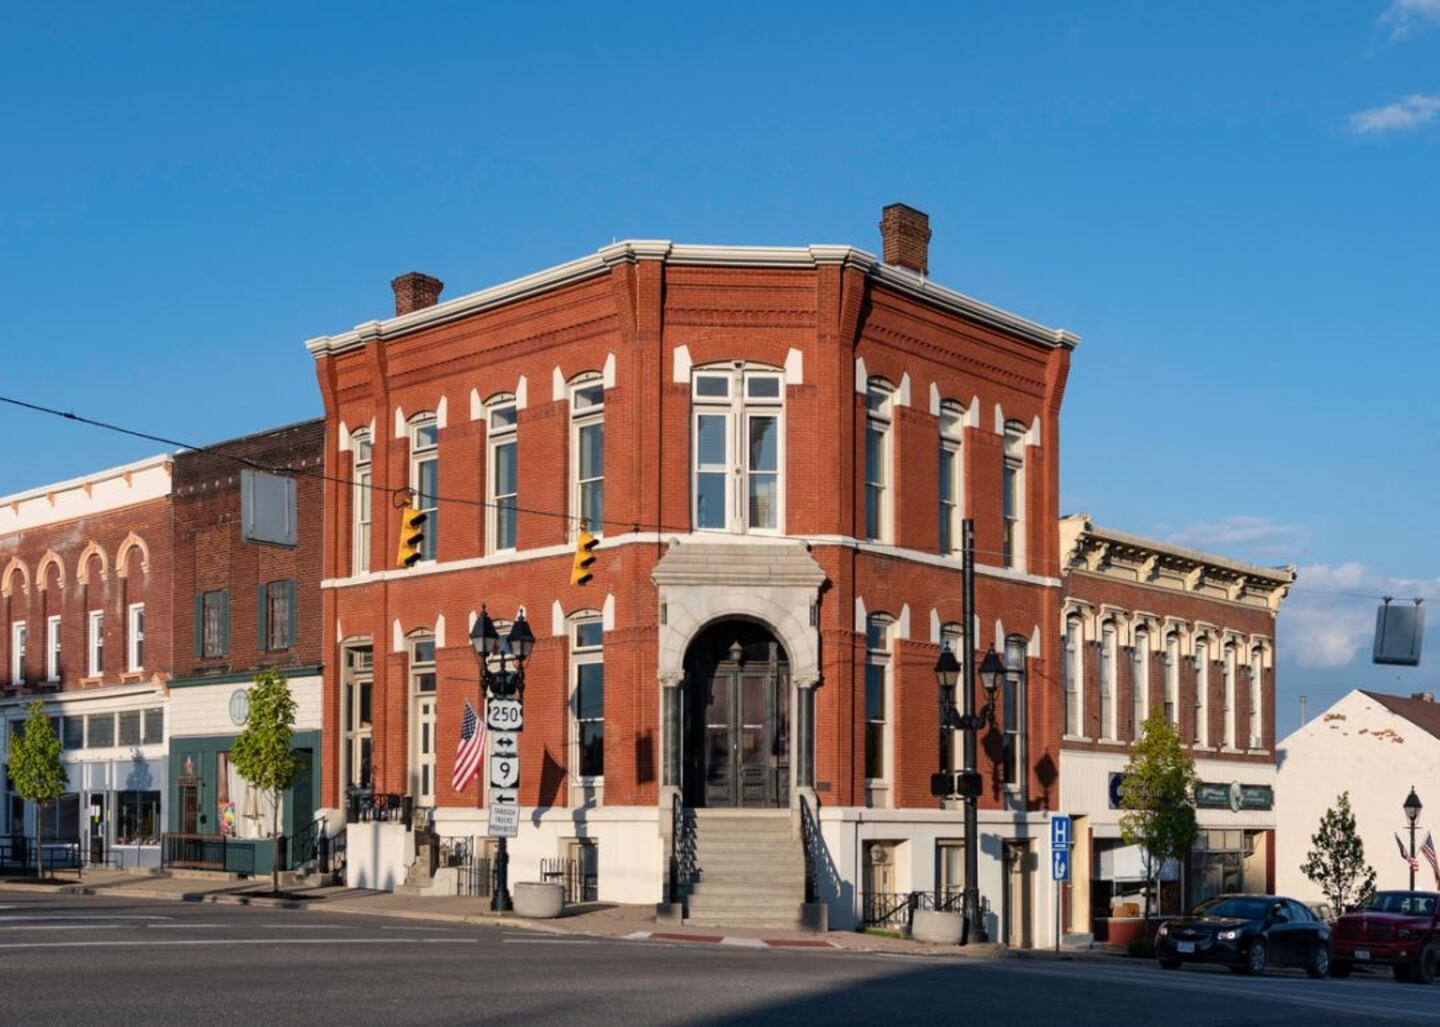
JNix // Shutterstock
#33. Columbiana County
- Life expectancy: 74.5 years
--- 1.1 years lower than the state average
Canva
#32. Preble County
- Life expectancy: 74.4 years
--- 1.2 years lower than the state average

Madison Muskopf // Shutterstock
#29. Coshocton County (tie)
- Life expectancy: 74.3 years
--- 1.3 years lower than the state average
JNix // Shutterstock
#29. Pickaway County (tie)
- Life expectancy: 74.3 years
--- 1.3 years lower than the state average
JNix // Shutterstock
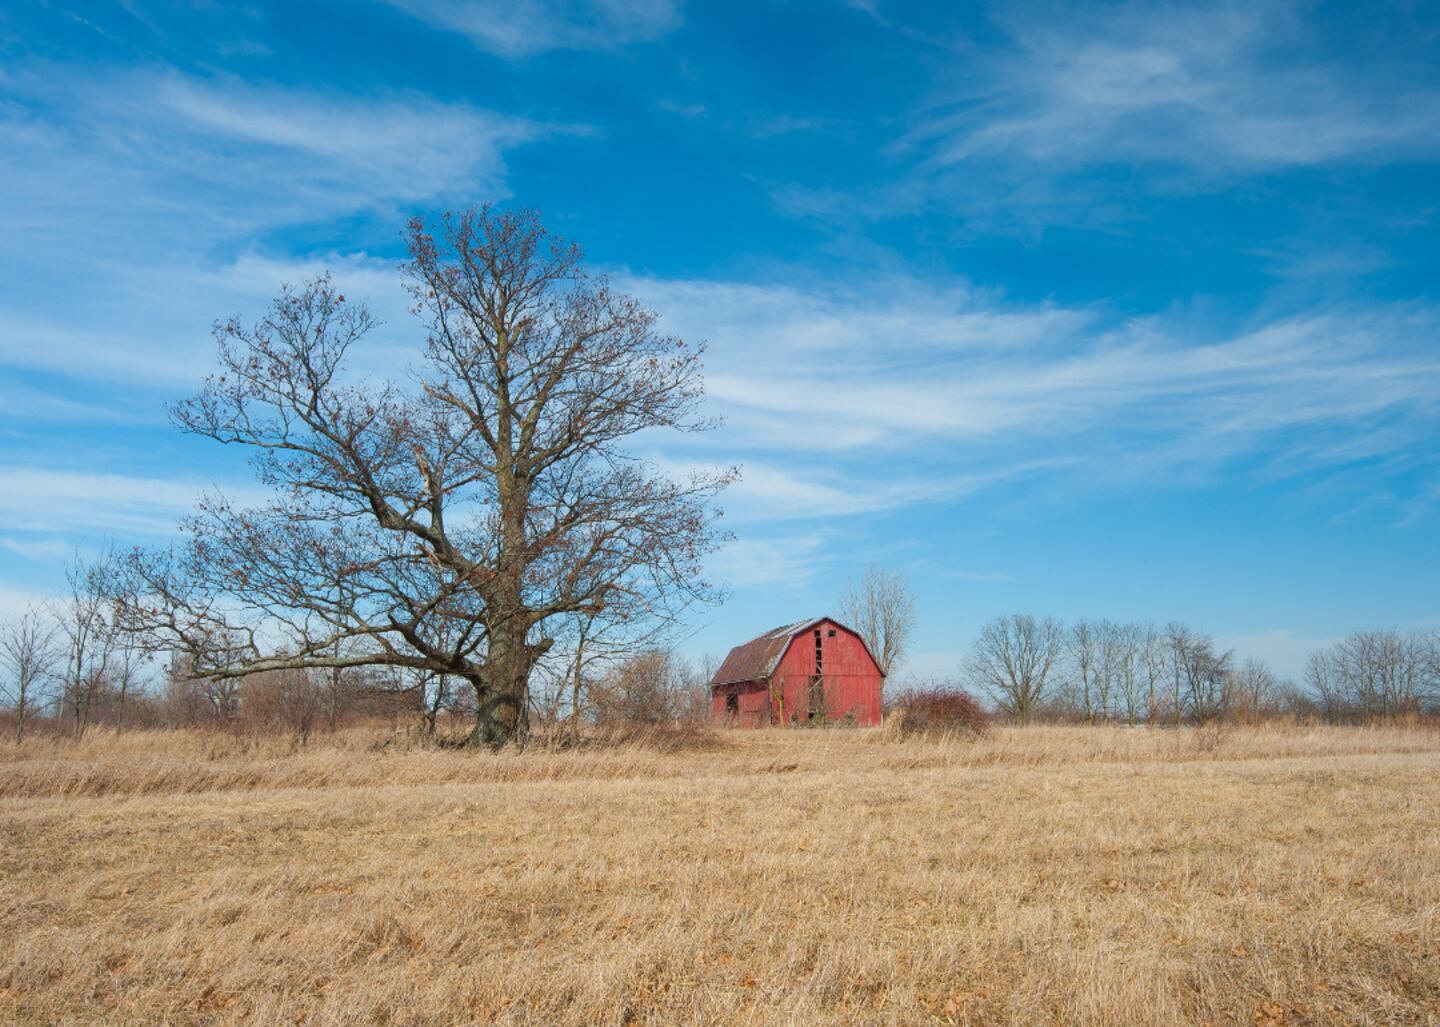
#29. Harrison County (tie)
- Life expectancy: 74.3 years
--- 1.3 years lower than the state average
Canva
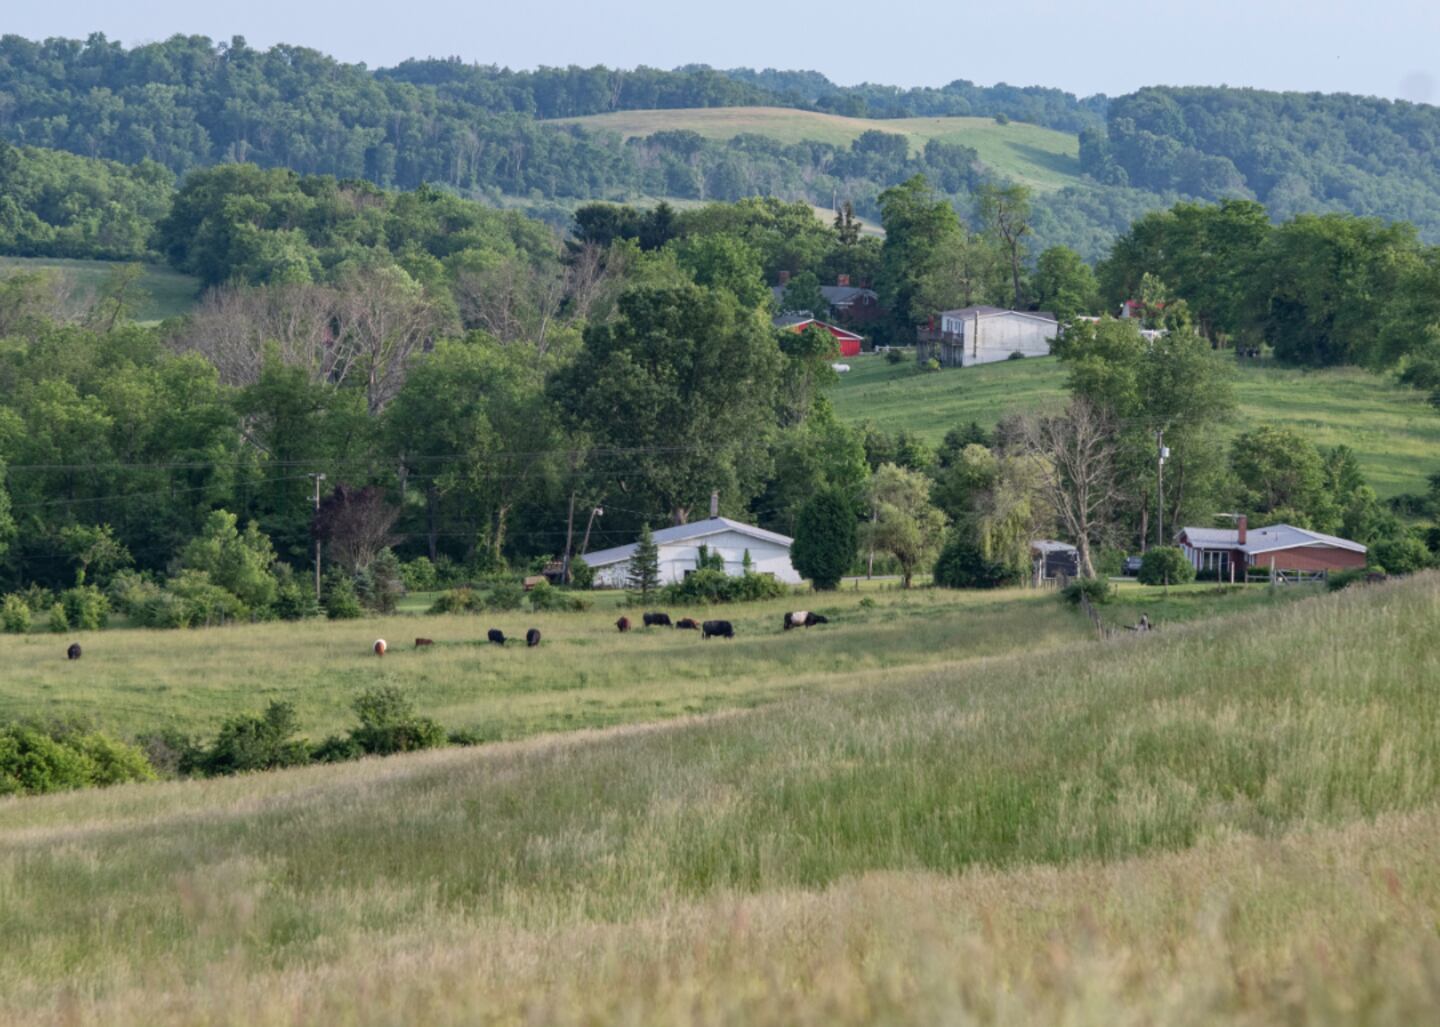
#26. Morgan County (tie)
- Life expectancy: 74.2 years
--- 1.4 years lower than the state average
Canva
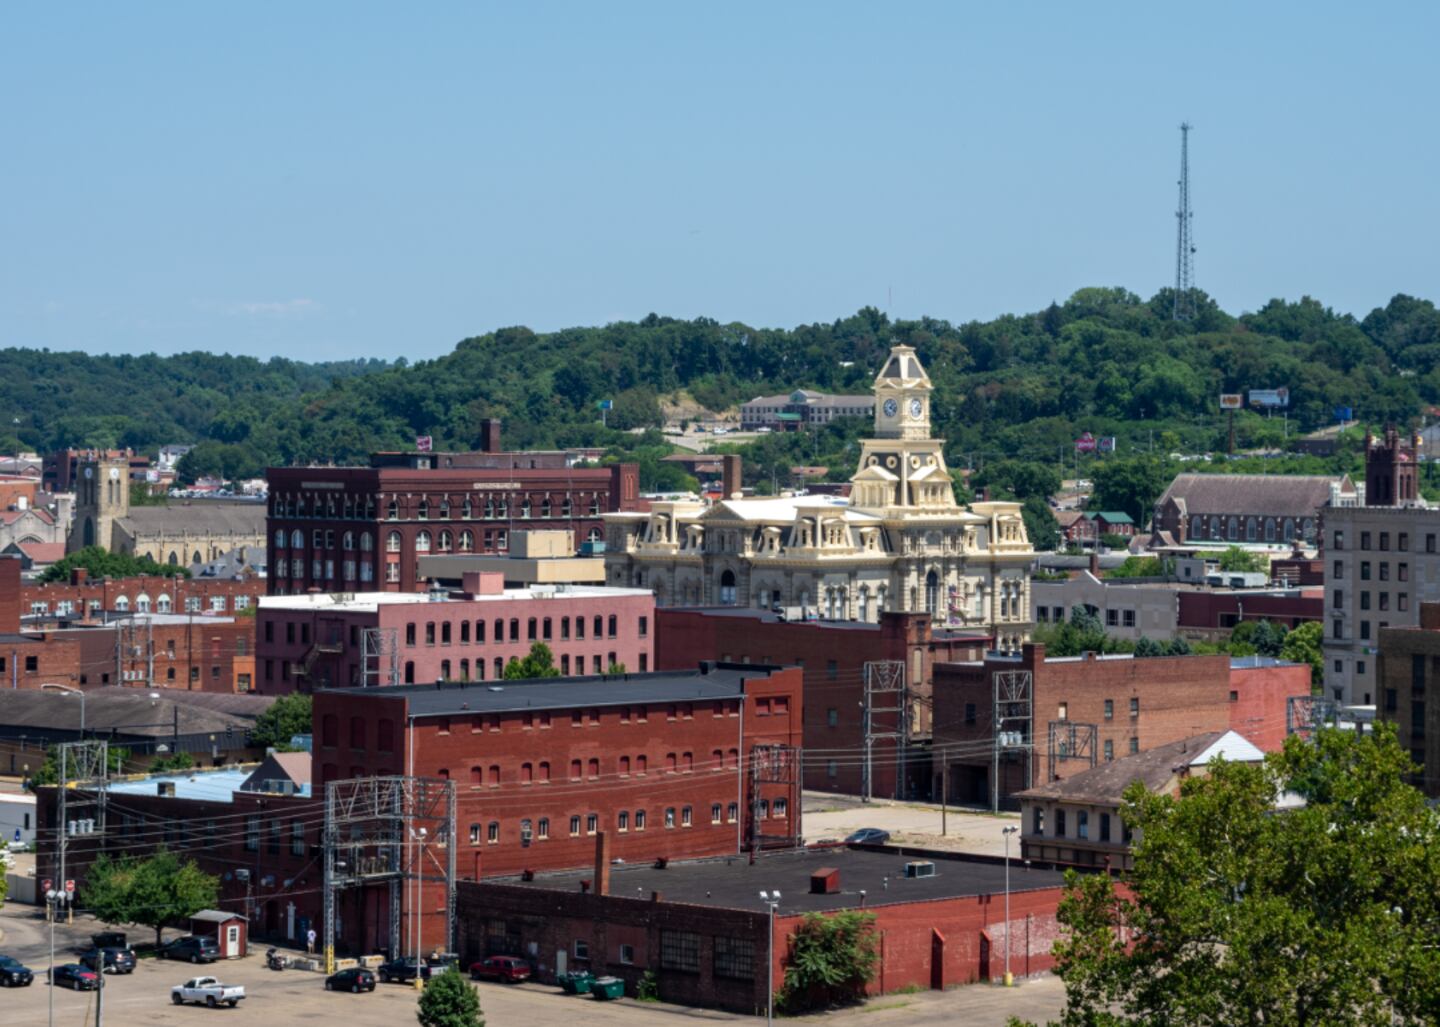
#26. Muskingum County (tie)
- Life expectancy: 74.2 years
--- 1.4 years lower than the state average
redtbird02 // Shutterstock
#26. Ashtabula County (tie)
- Life expectancy: 74.2 years
--- 1.4 years lower than the state average

Canva
#25. Mahoning County
- Life expectancy: 74.1 years
--- 1.5 years lower than the state average

James W. Thompson // Shutterstock
#23. Marion County (tie)
- Life expectancy: 74.0 years
--- 1.6 years lower than the state average

Canva
#23. Trumbull County (tie)
- Life expectancy: 74.0 years
--- 1.6 years lower than the state average

Canva
#20. Crawford County (tie)
- Life expectancy: 73.9 years
--- 1.7 years lower than the state average

JNix // Shutterstock
#20. Perry County (tie)
- Life expectancy: 73.9 years
--- 1.7 years lower than the state average

Canva
#20. Highland County (tie)
- Life expectancy: 73.9 years
--- 1.7 years lower than the state average

Michael Shake // Shutterstock
#18. Lucas County (tie)
- Life expectancy: 73.8 years
--- 1.8 years lower than the state average

arthurgphotography // Shutterstock
#18. Hocking County (tie)
- Life expectancy: 73.8 years
--- 1.8 years lower than the state average

Canva
#17. Montgomery County
- Life expectancy: 73.7 years
--- 1.9 years lower than the state average

JNix // Shutterstock
#16. Clinton County
- Life expectancy: 73.6 years
--- 2.0 years lower than the state average

Canva
#14. Hardin County (tie)
- Life expectancy: 73.4 years
--- 2.2 years lower than the state average

ADC Bradley // Shutterstock
#14. Brown County (tie)
- Life expectancy: 73.4 years
--- 2.2 years lower than the state average

Canva
#12. Ross County (tie)
- Life expectancy: 73.2 years
--- 2.4 years lower than the state average
Canva
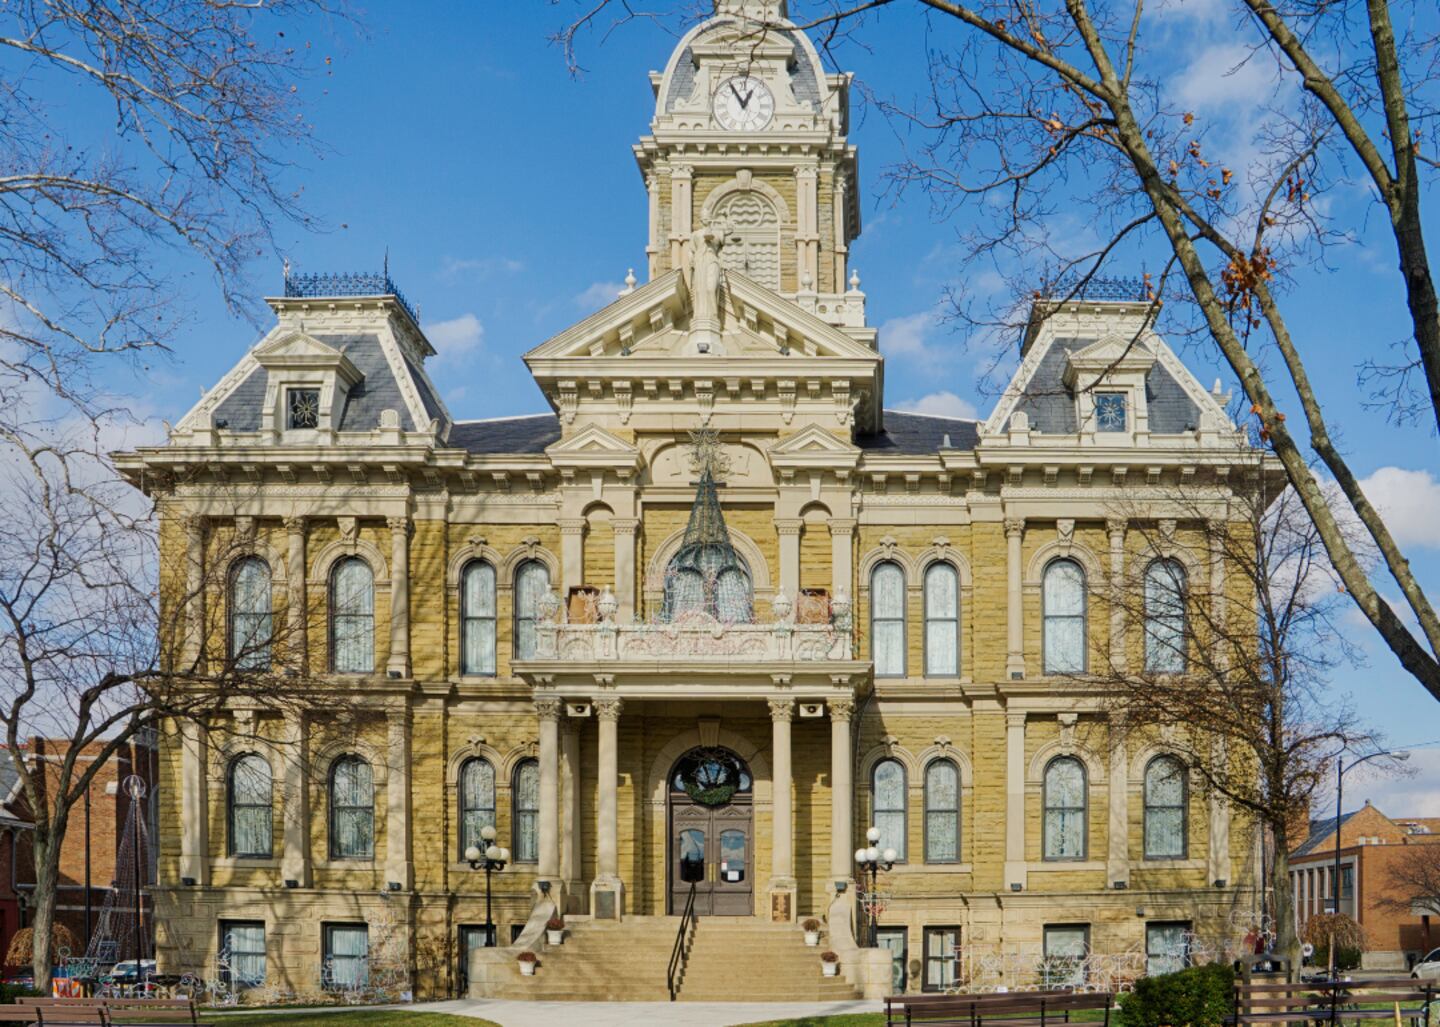
#12. Guernsey County (tie)
- Life expectancy: 73.2 years
--- 2.4 years lower than the state average

Canva
#10. Fayette County (tie)
- Life expectancy: 72.9 years
--- 2.7 years lower than the state average
James Marciniak // Shutterstock
#10. Clark County (tie)
- Life expectancy: 72.9 years
--- 2.7 years lower than the state average
Canva
#9. Meigs County
- Life expectancy: 72.7 years
--- 2.9 years lower than the state average

JNix // Shutterstock
#7. Gallia County (tie)
- Life expectancy: 72.6 years
--- 3.0 years lower than the state average
Canva
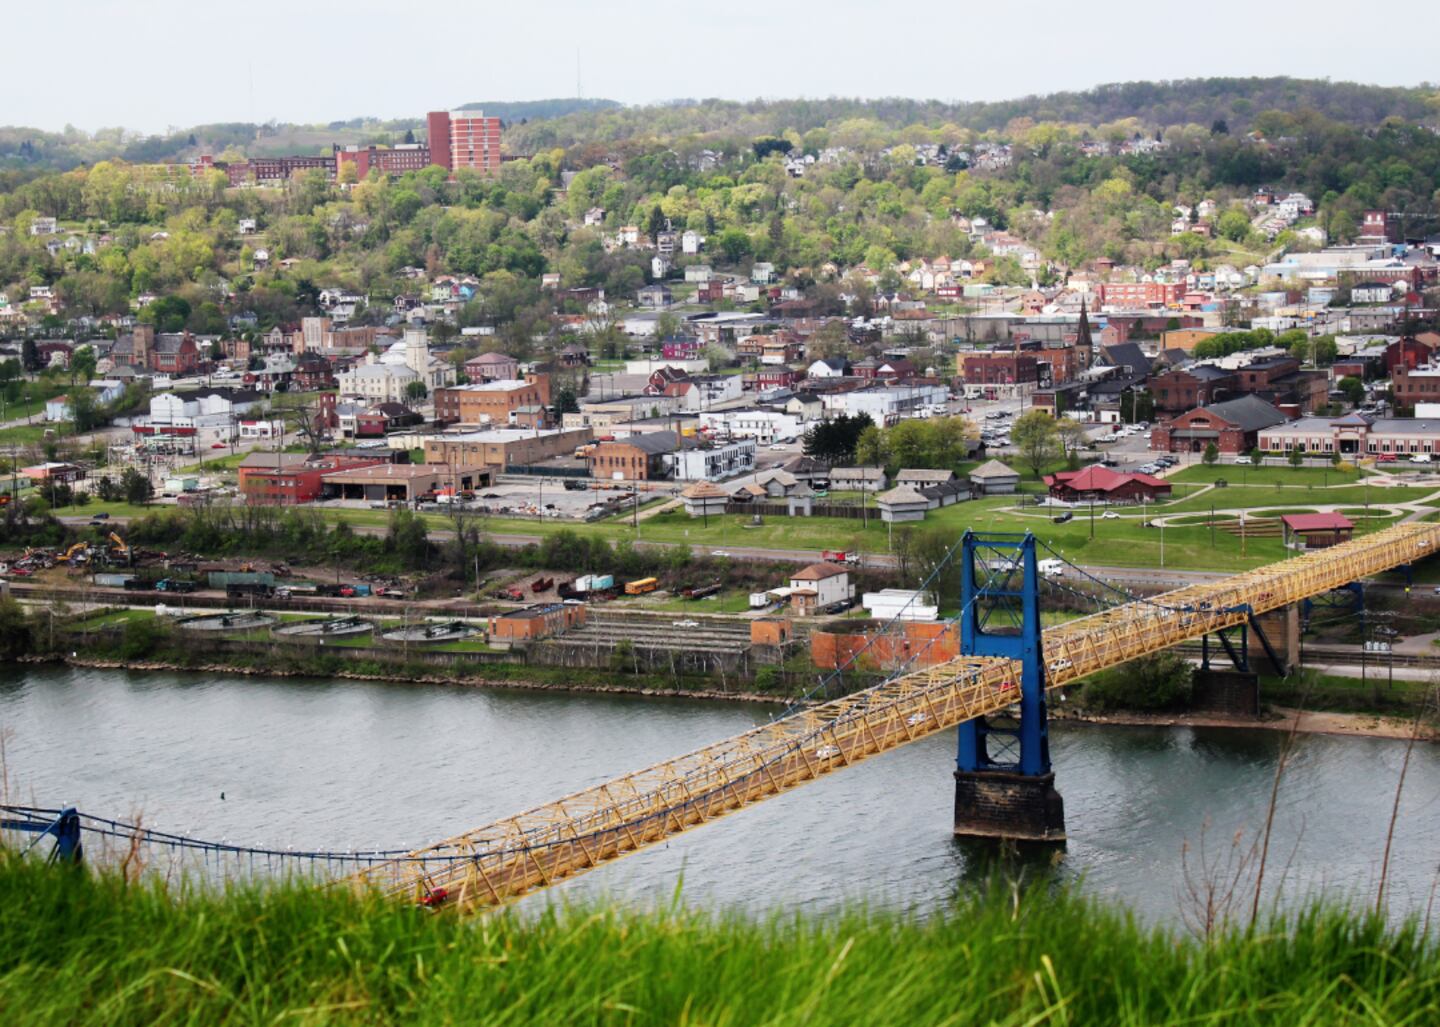
#7. Jefferson County (tie)
- Life expectancy: 72.6 years
--- 3.0 years lower than the state average

Canva
#6. Adams County
- Life expectancy: 71.4 years
--- 4.2 years lower than the state average

James Marciniak // Shutterstock
#5. Jackson County
- Life expectancy: 71.3 years
--- 4.3 years lower than the state average

The American Explorer // Shutterstock
#4. Lawrence County
- Life expectancy: 71.0 years
--- 4.6 years lower than the state average
The American Explorer // Shutterstock
#3. Vinton County
- Life expectancy: 70.9 years
--- 4.7 years lower than the state average

Canva
#2. Pike County
- Life expectancy: 70.6 years
--- 5.0 years lower than the state average
Canva
#1. Scioto County
- Life expectancy: 69.7 years
--- 5.9 years lower than the state average
This story features data reporting by Karim Noorani, writing by Kiersten Hickman, and is part of a series utilizing data automation across 49 states.


