
Life expectancy rates have been on the rise in the United States, with an increase of nearly seven years over the past half-century. (The average lifespan was 70.8 in 1970 and was documented as 77.5 in 2022, according to the Centers for Disease Control and Prevention.) There are many factors that can contribute to how long you'll live—from genetics to how much you drink or smoke, your diet and weight, and how physically active you are. But then there's the matter of where you live.
In some areas of the globe, dubbed "blue zones," there is a disproportionately high number of residents who live to at least 100 years old. These five particular pockets of the world—Ikaria, Greece; Loma Linda, California; Nicoya, Costa Rica, Okinawa, Japan; and Sardinia, Italy—are heavily researched, as scientists try to determine what it is about these residents' diets, lifestyles, and environments that can promote such longevity. While it may not be as obvious of a contributing factor, where you live can play a significant role in your overall lifespan, which is why some states and even counties in the U.S. tend to see longer life expectancy rates compared to others.
By delving into 2024 County Health Rankings & Roadmaps from the University of Wisconsin Population Health Institute, Stacker identified the counties with the longest life expectancy in Ohio. Life expectancy measures the average number of years from birth a person can expect to live and is calculated based on the number of deaths in a given time period and the average number of people at risk of dying during that period. Counties with unreliable or insufficient data were excluded from the analysis. Mortality data came from the National Vital Statistics System.
Read on to see if your county made the list.

Showcase Imaging // Shutterstock
#41. Summit County (tie)
- Life expectancy: 75.7 years
--- 0.1 years higher than the state average

Canva
#41. Seneca County (tie)
- Life expectancy: 75.7 years
--- 0.1 years higher than the state average

Canva
#41. Cuyahoga County (tie)
- Life expectancy: 75.7 years
--- 0.1 years higher than the state average

Canva
#41. Logan County (tie)
- Life expectancy: 75.7 years
--- 0.1 years higher than the state average

Wendy van Overstreet // Shutterstock
#38. Athens County (tie)
- Life expectancy: 75.8 years
--- 0.2 years higher than the state average
Canva
#38. Darke County (tie)
- Life expectancy: 75.8 years
--- 0.2 years higher than the state average

photo.ua // Shutterstock
#38. Hamilton County (tie)
- Life expectancy: 75.8 years
--- 0.2 years higher than the state average

Canva
#36. Monroe County (tie)
- Life expectancy: 75.9 years
--- 0.3 years higher than the state average

Sean Pavone // Shutterstock
#36. Franklin County (tie)
- Life expectancy: 75.9 years
--- 0.3 years higher than the state average

Canva
#33. Ashland County (tie)
- Life expectancy: 76.0 years
--- 0.4 years higher than the state average

Canva
#33. Washington County (tie)
- Life expectancy: 76.0 years
--- 0.4 years higher than the state average

Canva
#33. Champaign County (tie)
- Life expectancy: 76.0 years
--- 0.4 years higher than the state average

Kenneth Sponsler // Shutterstock
#30. Licking County (tie)
- Life expectancy: 76.1 years
--- 0.5 years higher than the state average
Canva
#30. Wyandot County (tie)
- Life expectancy: 76.1 years
--- 0.5 years higher than the state average

Kenneth Keifer // Shutterstock
#30. Madison County (tie)
- Life expectancy: 76.1 years
--- 0.5 years higher than the state average

Canva
#26. Wayne County (tie)
- Life expectancy: 76.4 years
--- 0.8 years higher than the state average

Canva
#26. Miami County (tie)
- Life expectancy: 76.4 years
--- 0.8 years higher than the state average
Nagel Photography // Shutterstock
#26. Van Wert County (tie)
- Life expectancy: 76.4 years
--- 0.8 years higher than the state average

Roberto Galan // Shutterstock
#26. Defiance County (tie)
- Life expectancy: 76.4 years
--- 0.8 years higher than the state average
Roberto Galan // Shutterstock
#25. Williams County
- Life expectancy: 76.5 years
--- 0.9 years higher than the state average

Canva
#23. Henry County (tie)
- Life expectancy: 76.6 years
--- 1.0 years higher than the state average
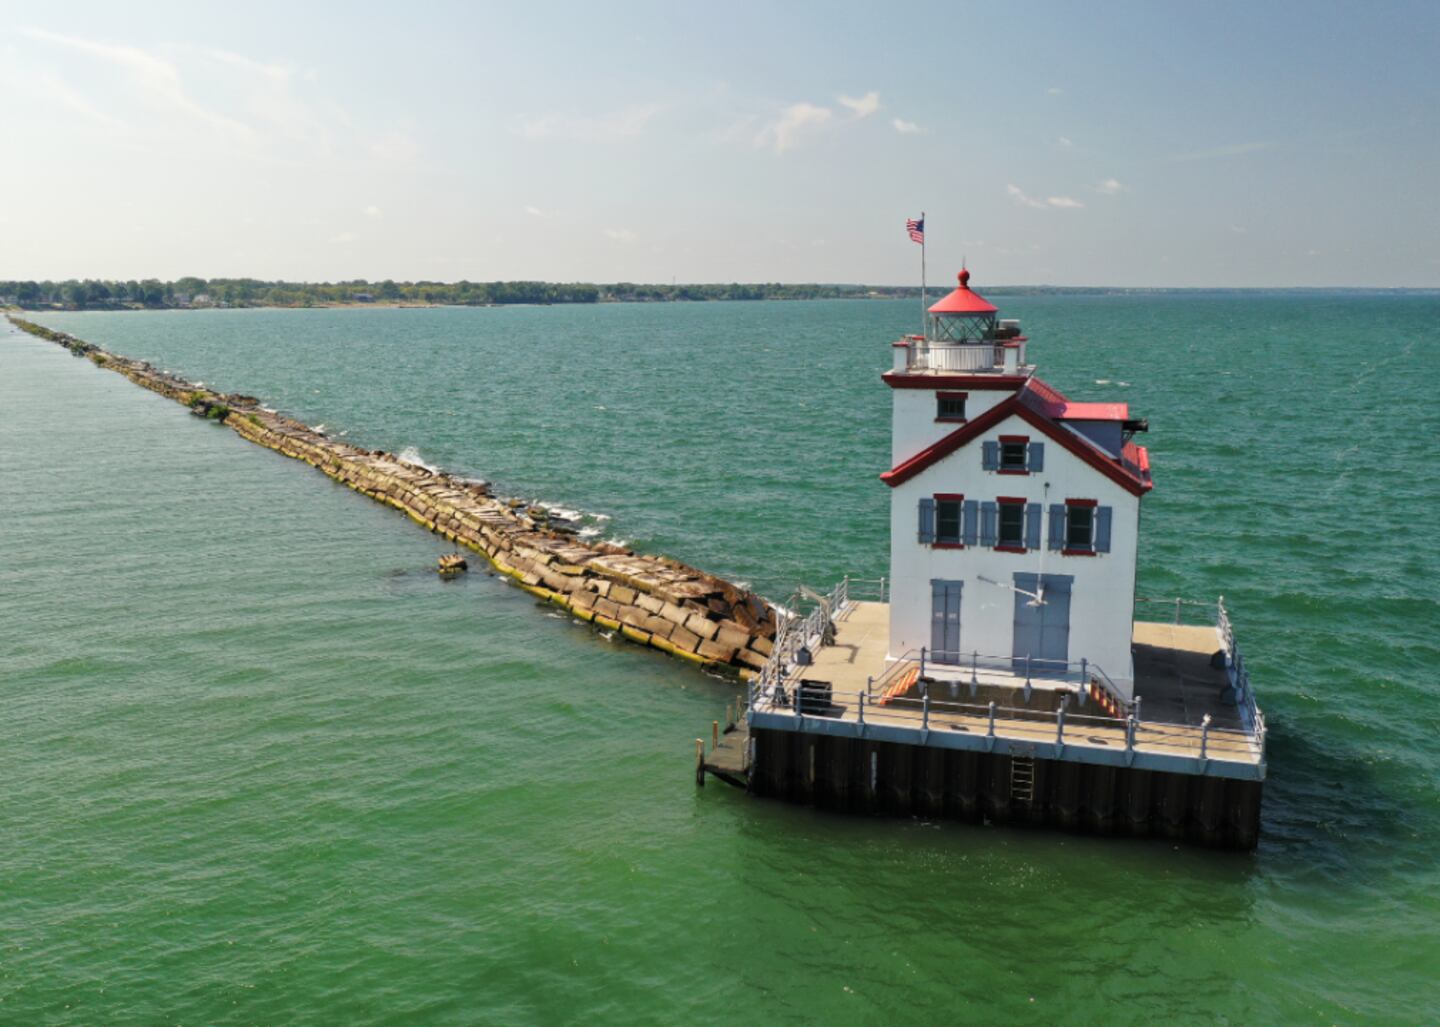
Lake Front Drones // Shutterstock
#23. Lorain County (tie)
- Life expectancy: 76.6 years
--- 1.0 years higher than the state average

Canva
#21. Clermont County (tie)
- Life expectancy: 76.7 years
--- 1.1 years higher than the state average
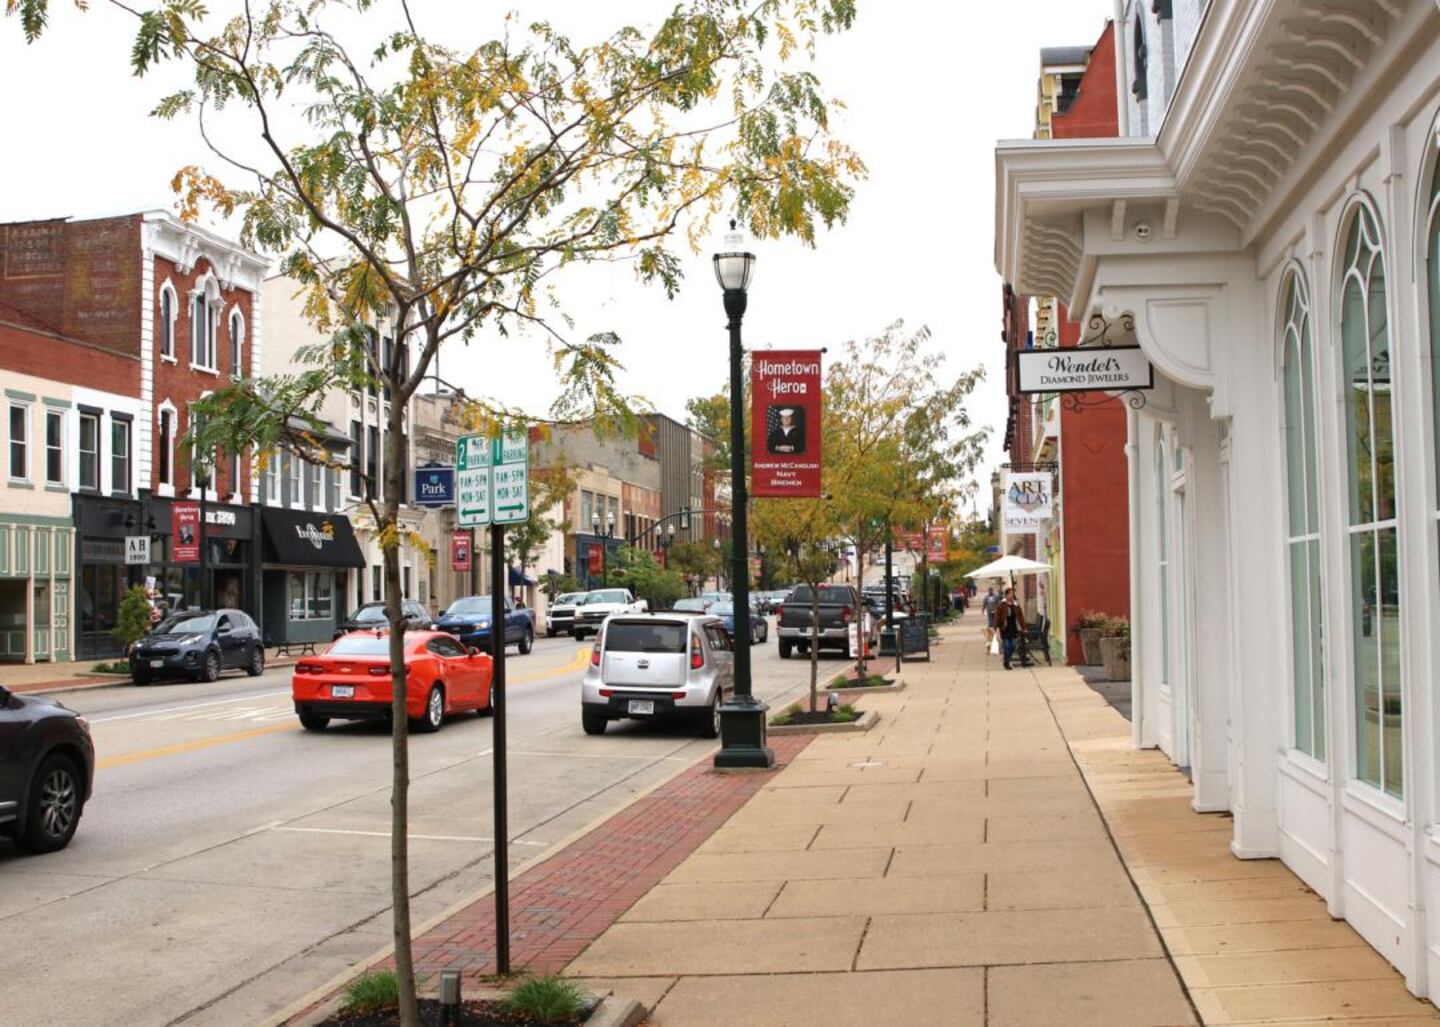
Eric Glenn // Shutterstock
#21. Fairfield County (tie)
- Life expectancy: 76.7 years
--- 1.1 years higher than the state average

Canva
#20. Morrow County
- Life expectancy: 76.8 years
--- 1.2 years higher than the state average

Roberto Galan // Shutterstock
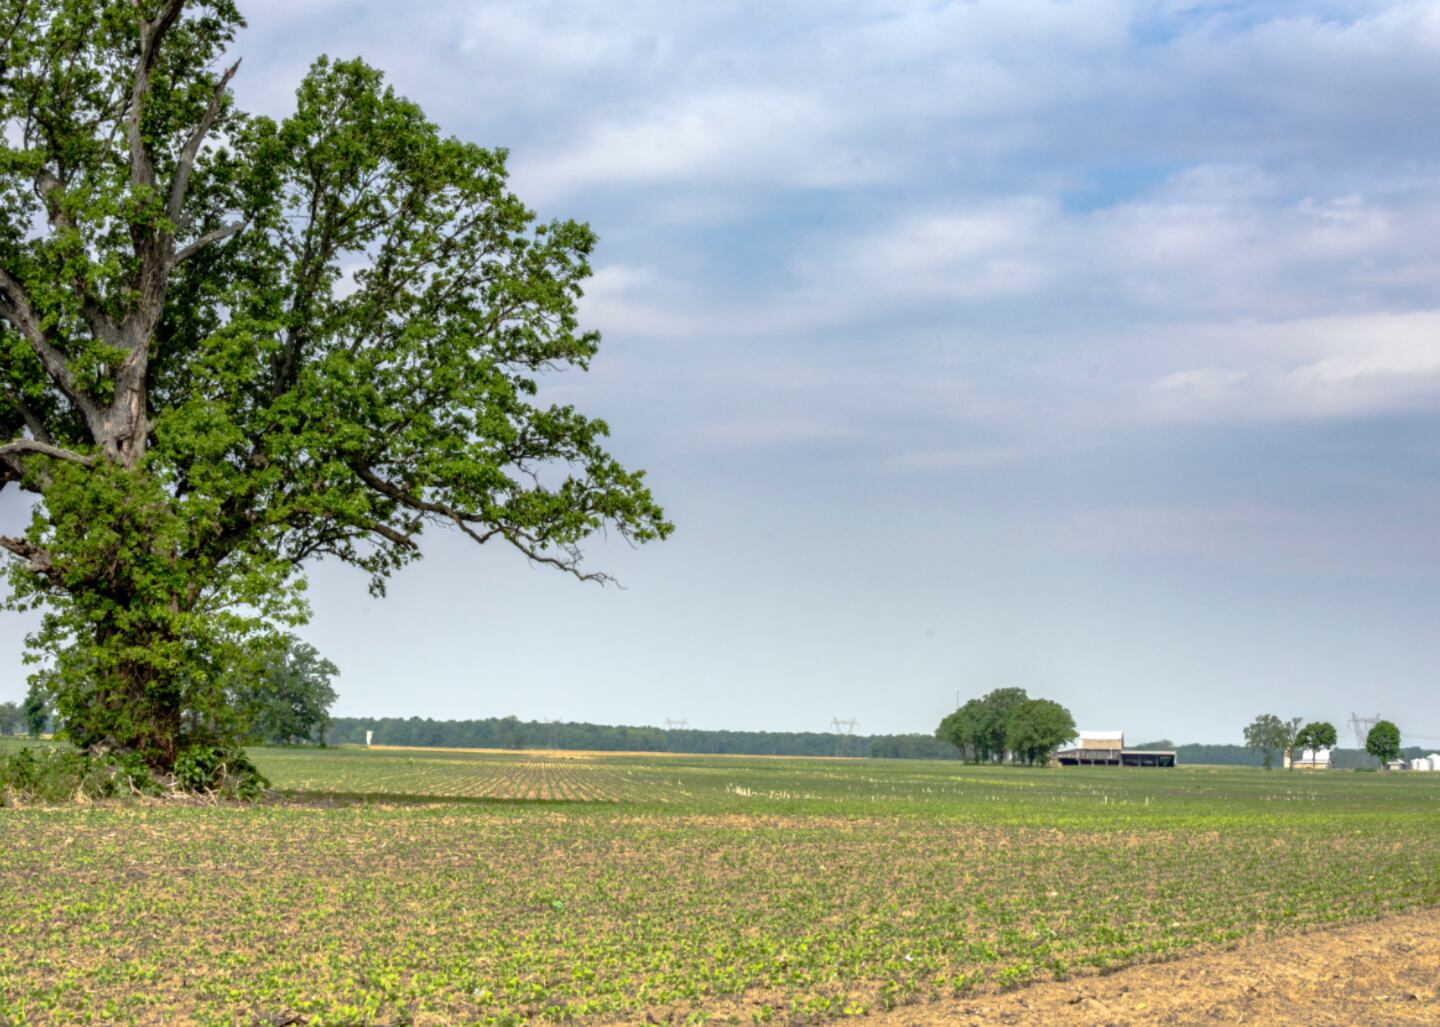
#18. Fulton County (tie)
- Life expectancy: 76.9 years
--- 1.3 years higher than the state average

Joshua D'Ariano // Shutterstock
#18. Hancock County (tie)
- Life expectancy: 76.9 years
--- 1.3 years higher than the state average

jul11h // Shutterstock
#15. Portage County (tie)
- Life expectancy: 77.0 years
--- 1.4 years higher than the state average

Anne Kitzman // Shutterstock
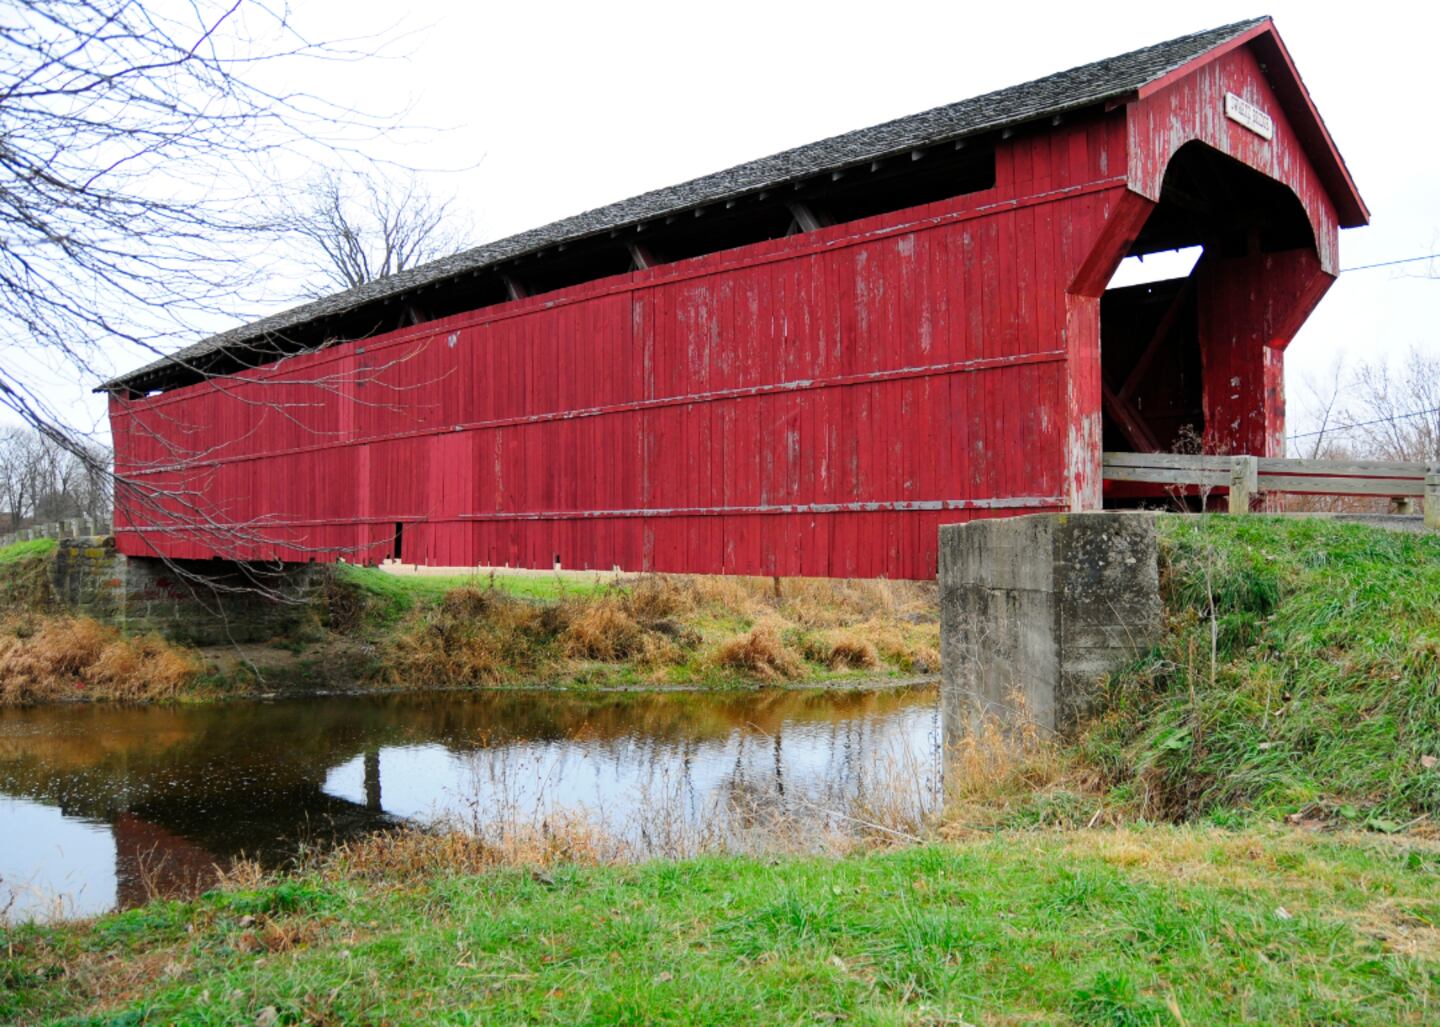
#15. Paulding County (tie)
- Life expectancy: 77.0 years
--- 1.4 years higher than the state average

Kenneth Keifer // Shutterstock
#15. Knox County (tie)
- Life expectancy: 77.0 years
--- 1.4 years higher than the state average
Canva
#14. Auglaize County
- Life expectancy: 77.2 years
--- 1.6 years higher than the state average

Canva
#13. Ottawa County
- Life expectancy: 77.3 years
--- 1.7 years higher than the state average

Mikhalis Makarov // Shutterstock
#11. Lake County (tie)
- Life expectancy: 77.5 years
--- 1.9 years higher than the state average

Almal3xia // Shutterstock
#11. Greene County (tie)
- Life expectancy: 77.5 years
--- 1.9 years higher than the state average

Rosamar // Shutterstock
#10. Wood County
- Life expectancy: 77.7 years
--- 2.1 years higher than the state average

CourtneySimons // Shutterstock
#9. Mercer County
- Life expectancy: 78.0 years
--- 2.4 years higher than the state average
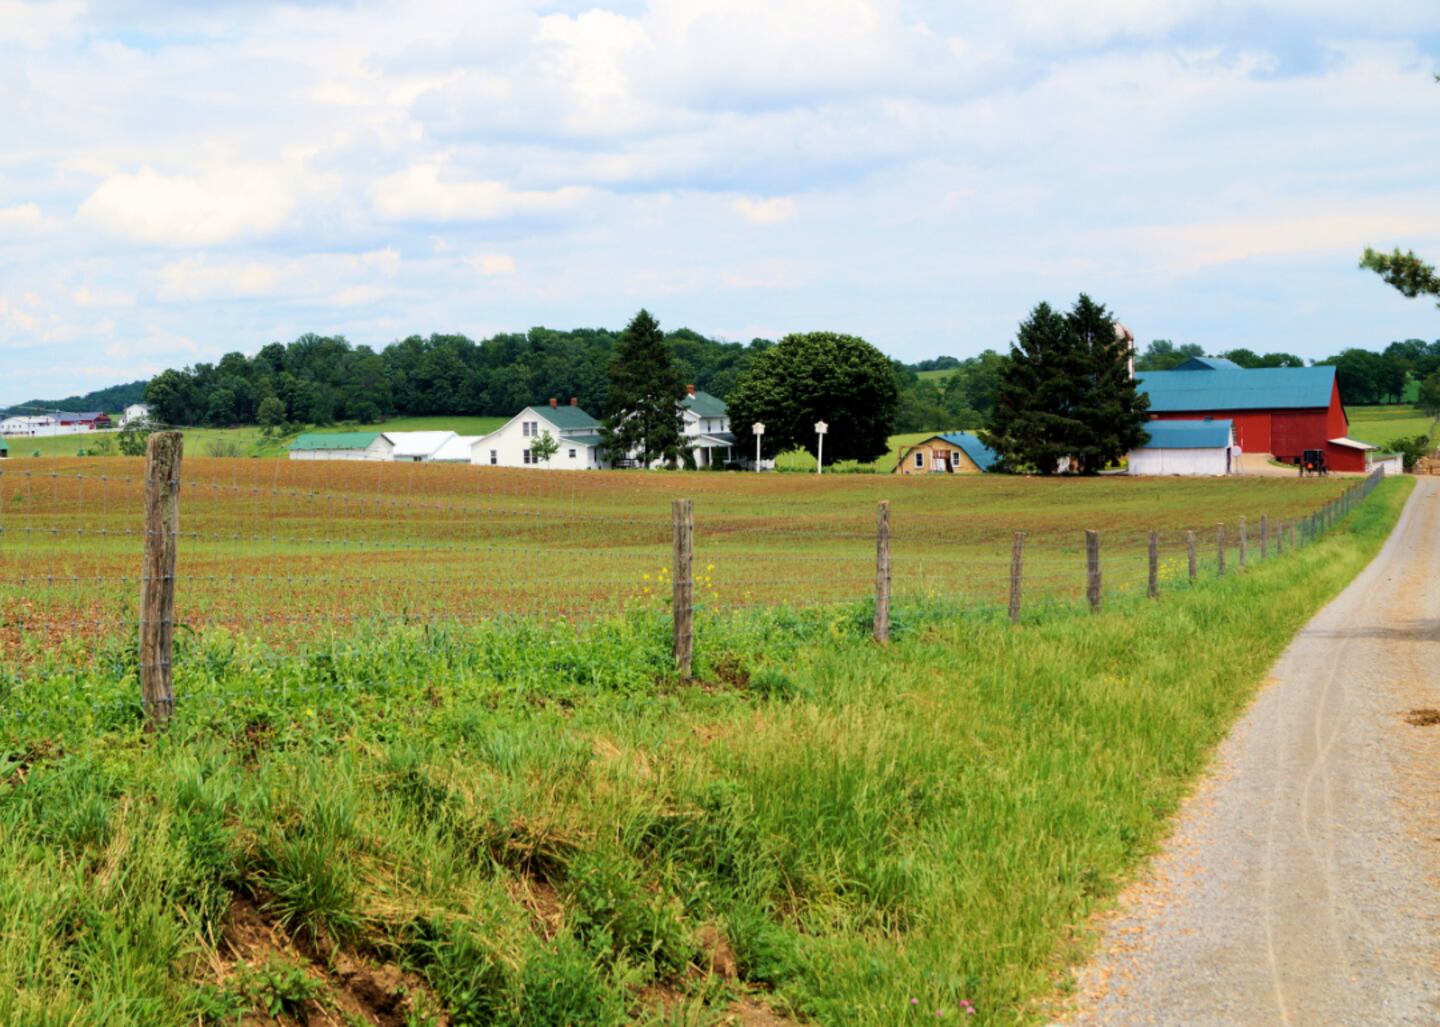
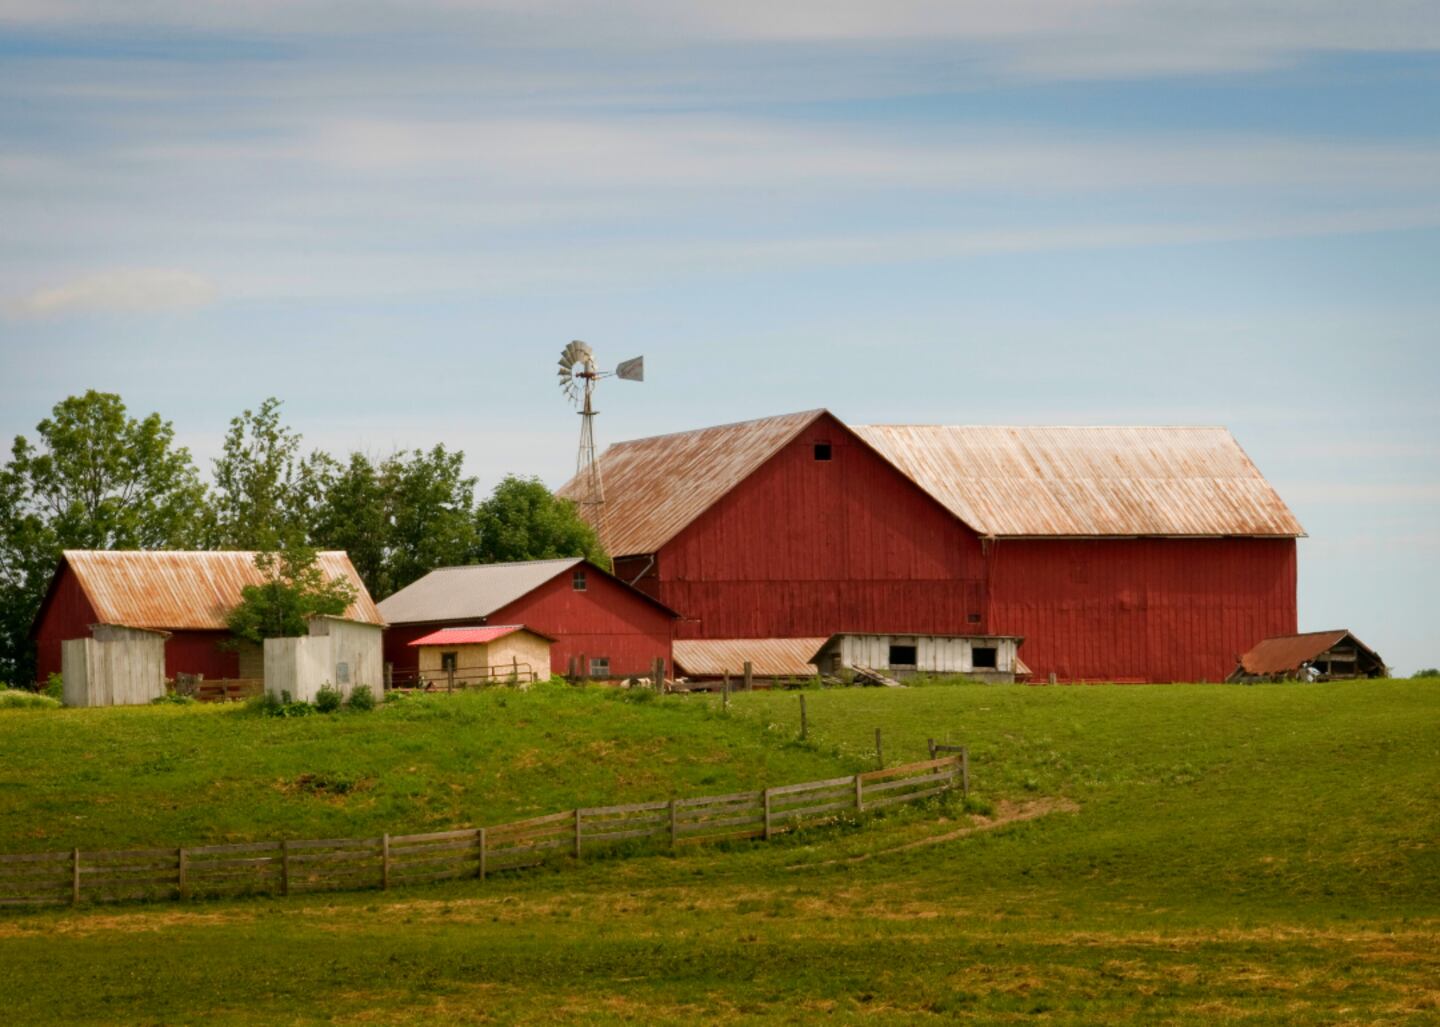
Canva
#8. Holmes County
- Life expectancy: 78.2 years
--- 2.6 years higher than the state average
Kilmer Media // Shutterstock
#7. Warren County
- Life expectancy: 78.4 years
--- 2.8 years higher than the state average

Canva
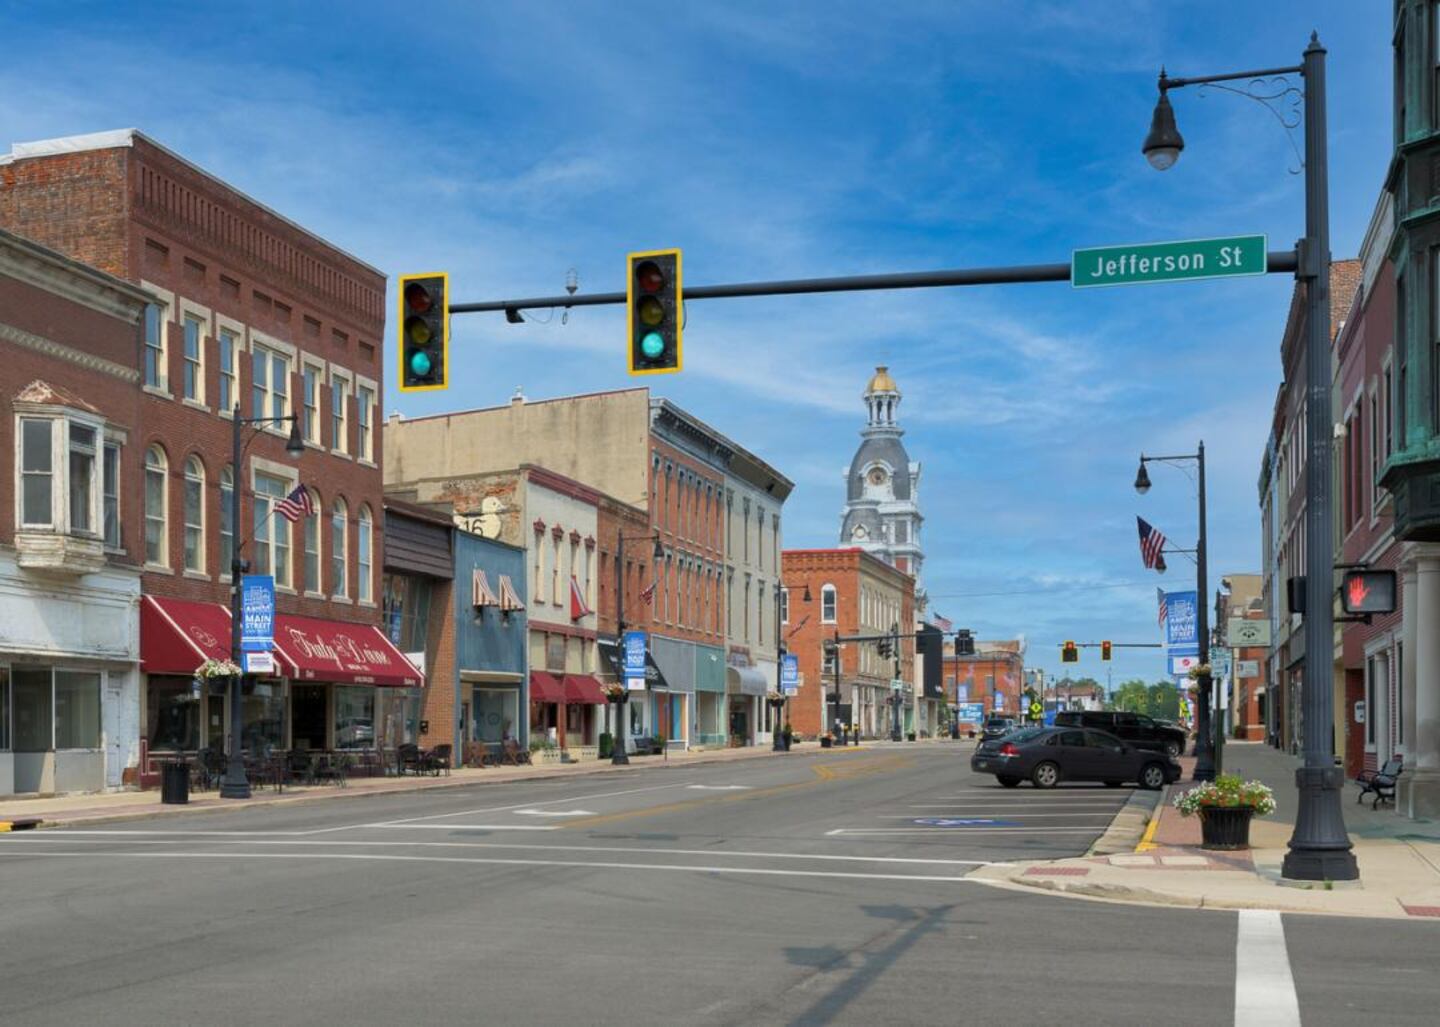
#6. Union County
- Life expectancy: 78.9 years
--- 3.3 years higher than the state average
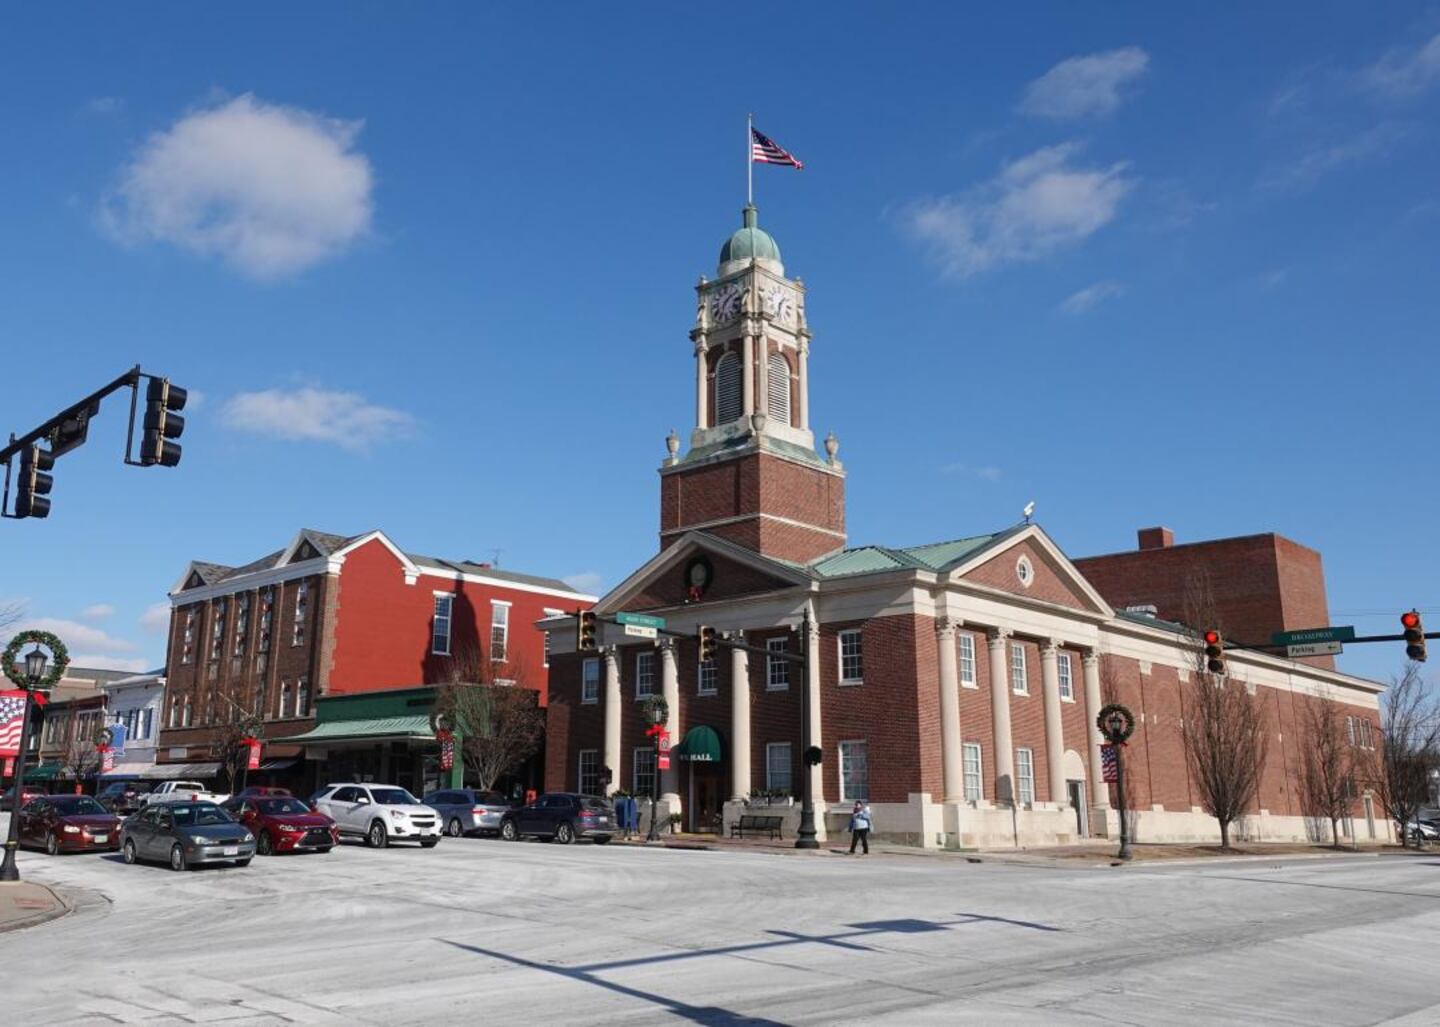
Kenneth Sponsler // Shutterstock
#5. Medina County
- Life expectancy: 79.3 years
--- 3.7 years higher than the state average

Canva
#4. Putnam County
- Life expectancy: 79.5 years
--- 3.9 years higher than the state average
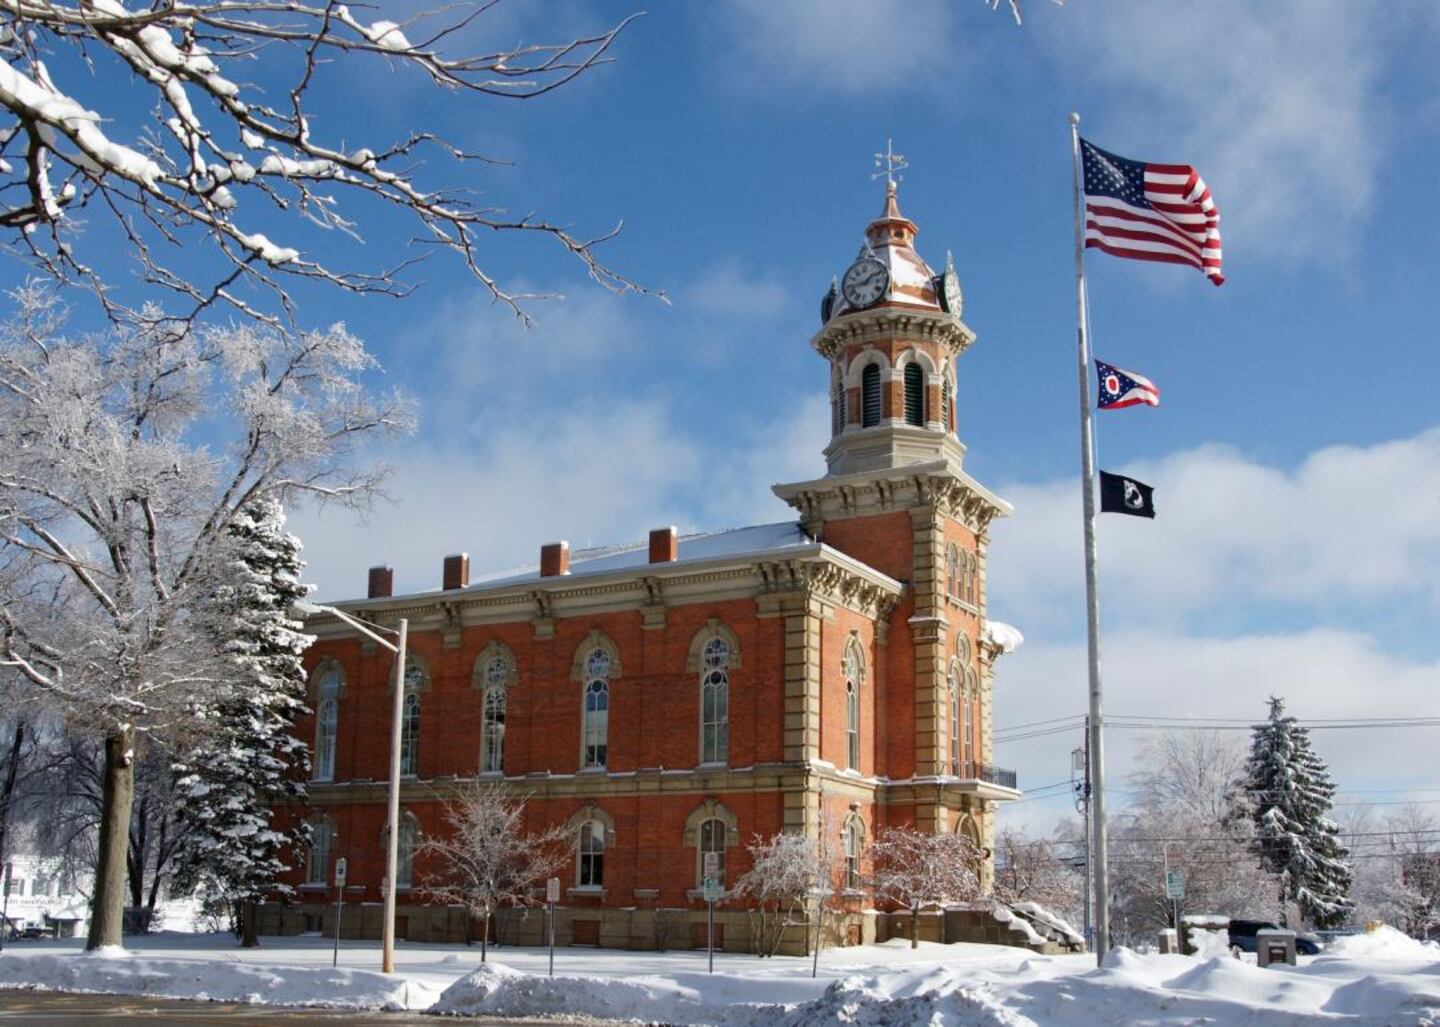
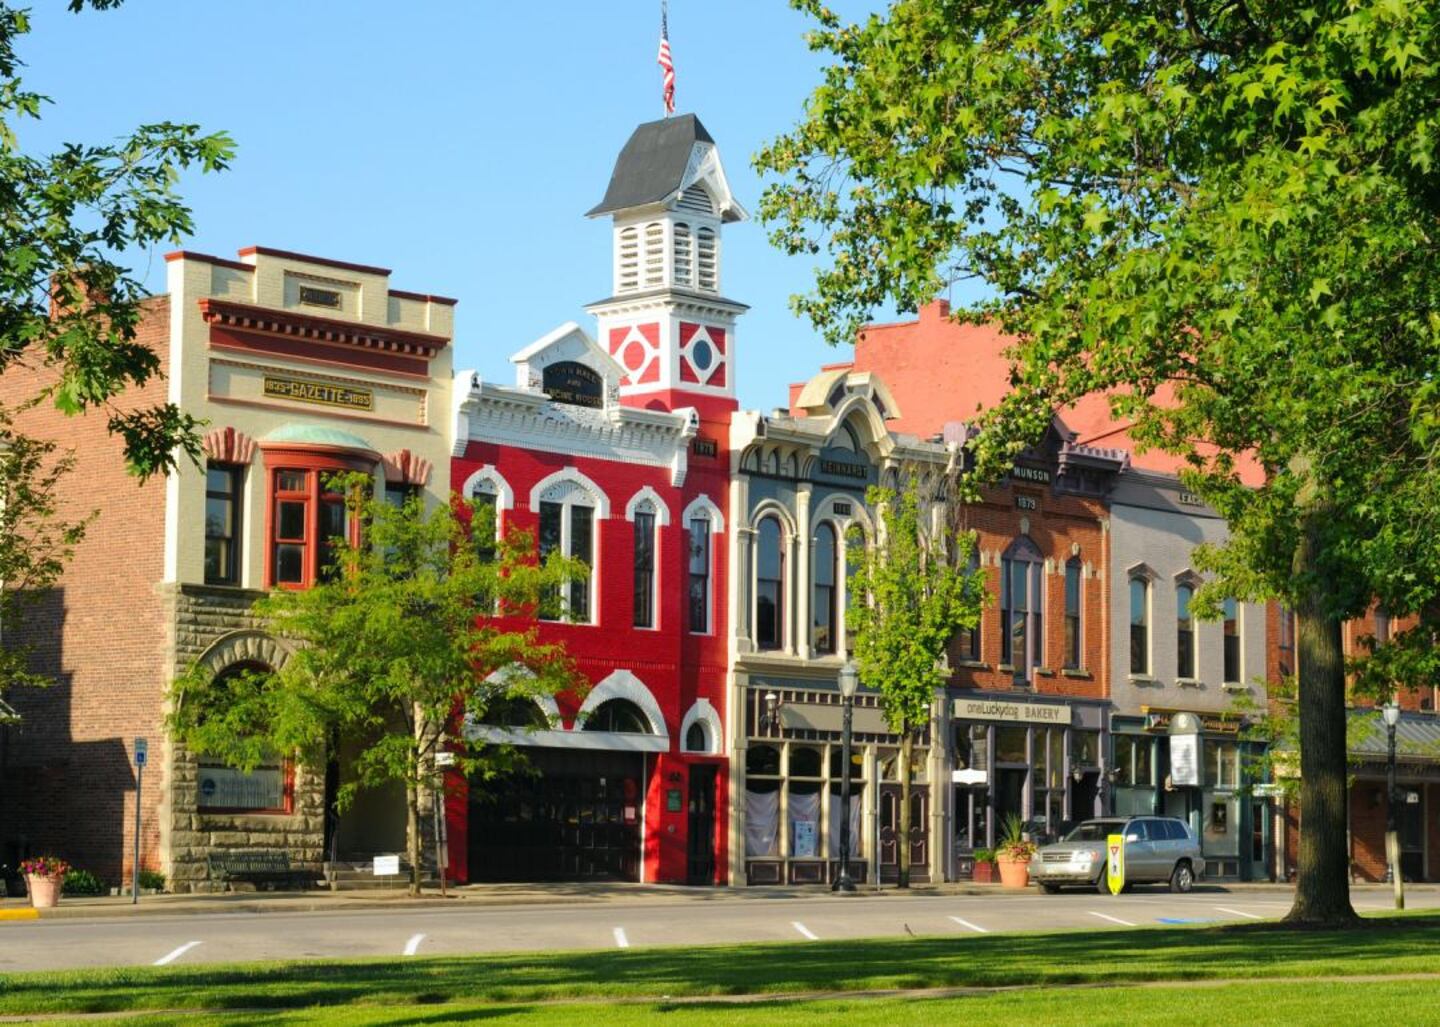
Susie Prentice // Shutterstock
#3. Geauga County
- Life expectancy: 80.0 years
--- 4.4 years higher than the state average

Kenneth Keifer // Shutterstock
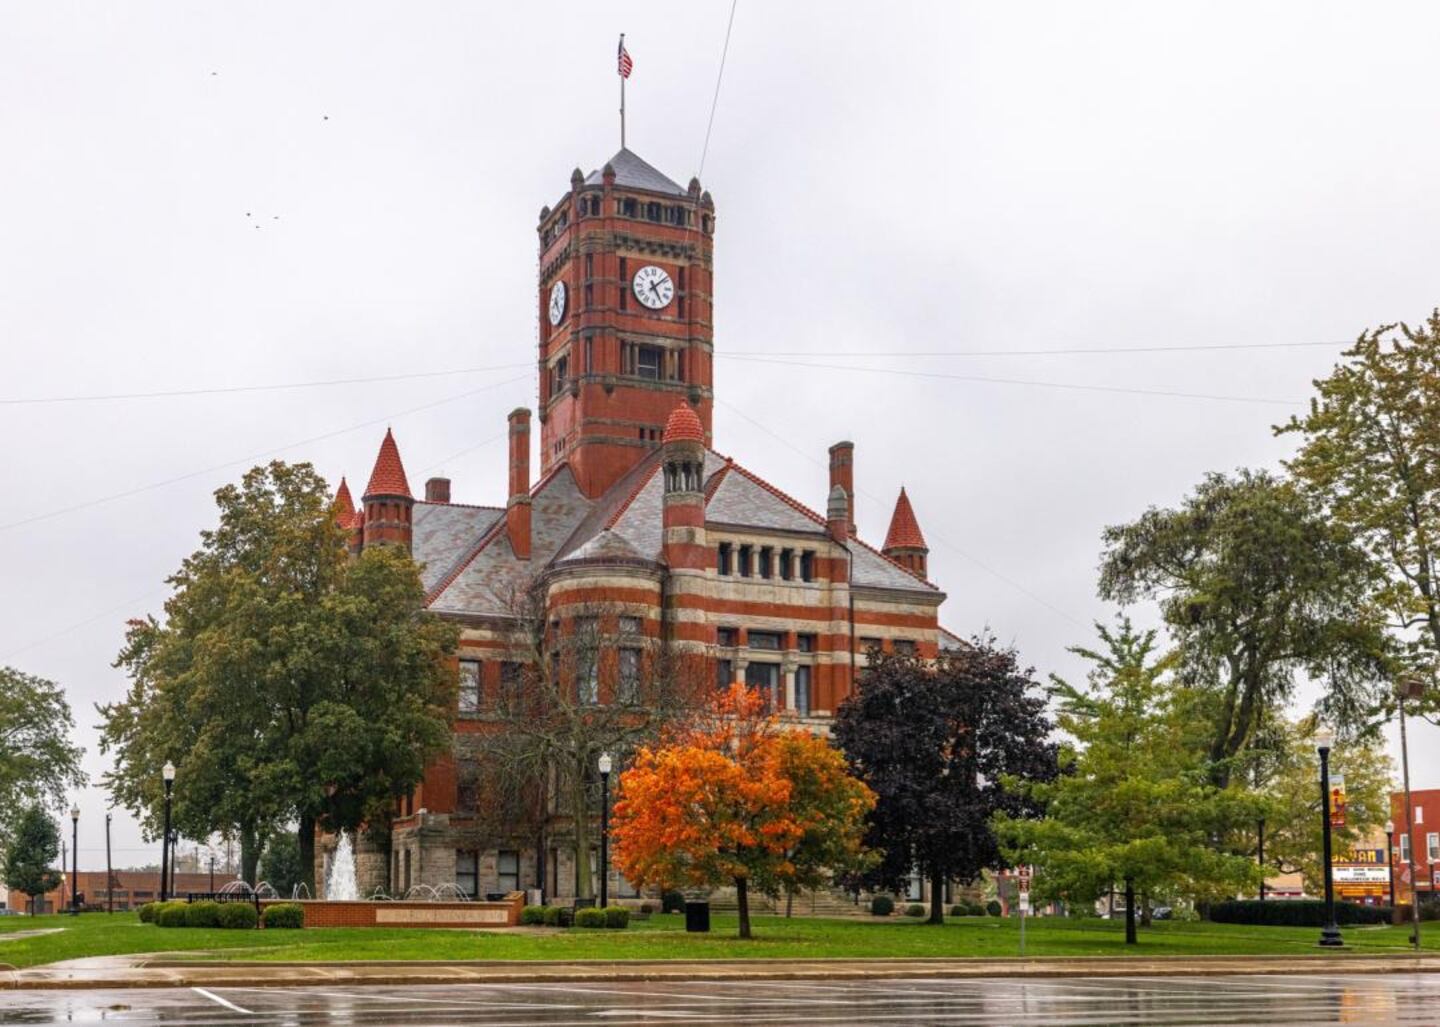
#2. Noble County
- Life expectancy: 81.1 years
--- 5.5 years higher than the state average

dvgpro // Shutterstock
#1. Delaware County
- Life expectancy: 81.2 years
--- 5.6 years higher than the state average
This story features data reporting by Karim Noorani, writing by Kiersten Hickman, and is part of a series utilizing data automation across 50 states.


